Table of Contents
Overview
The Survey Dashboard provides a centralized view of customer feedback and satisfaction metrics across programs, brands, channels, supervisors, and agents. It enables users to monitor survey performance, analyze trends, and drill down into detailed survey responses through interactive dashboards and reports.
The dashboard presents survey insights in a visual and structured format, helping users identify performance patterns, evaluate customer experience, and make informed, data-driven decisions.
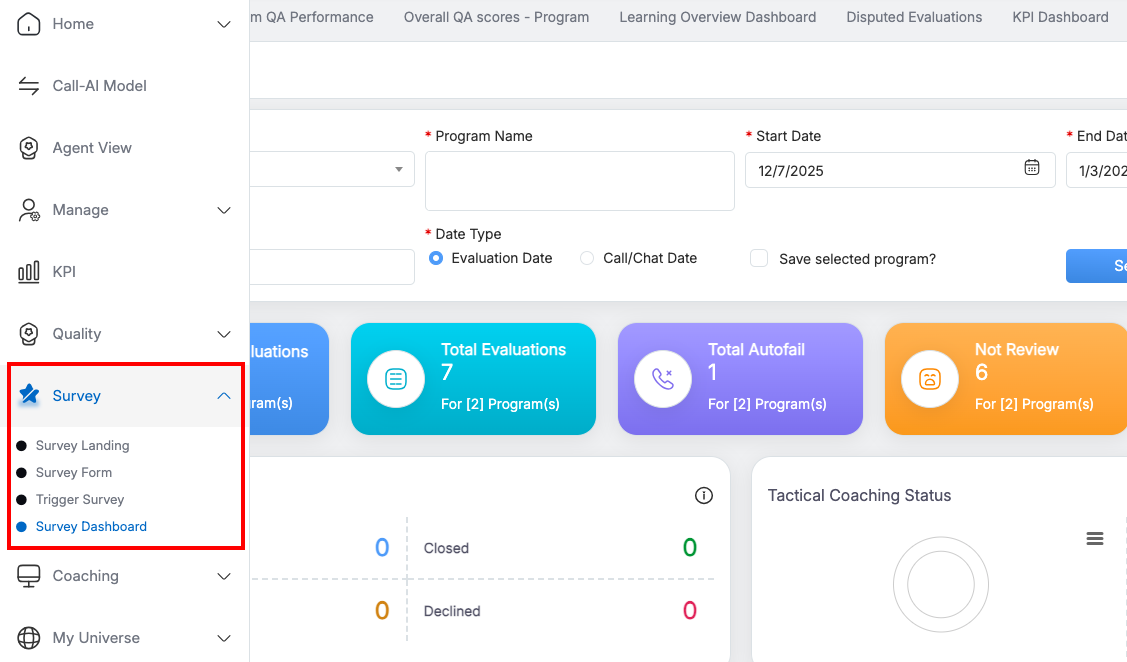
Survey Dashboard
What the Survey Dashboard Offers
The Survey Dashboard allows users to:
- View customer satisfaction metrics through dashboards and reports
- Apply flexible filters for targeted analysis
- Analyze trends and performance patterns over time
- Compare agents, supervisors, brands, and channels
- Drill down from high-level metrics to individual survey details
Survey Screens Available
The Survey Dashboard consists of the following screens:
-
Dashboard
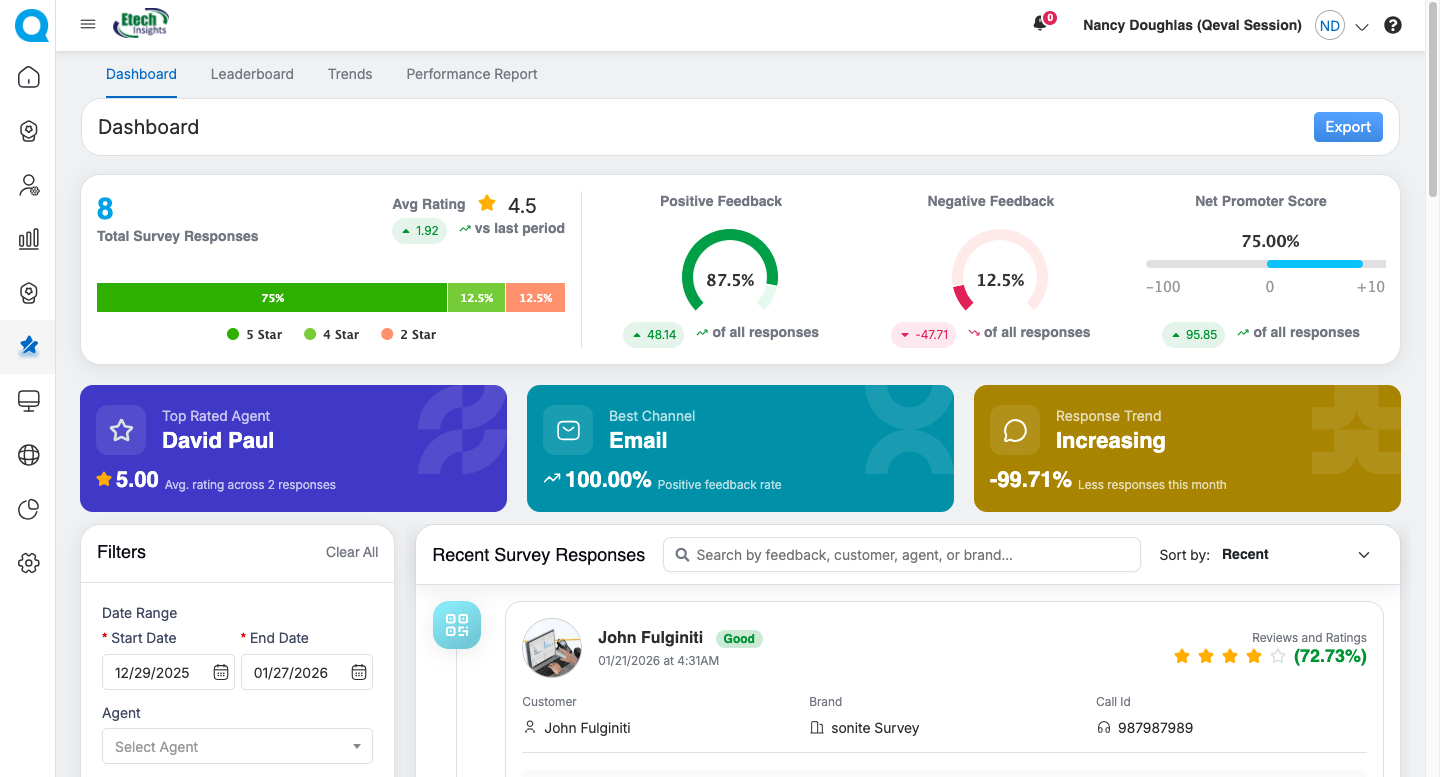
Dashboard
-
Leaderboard
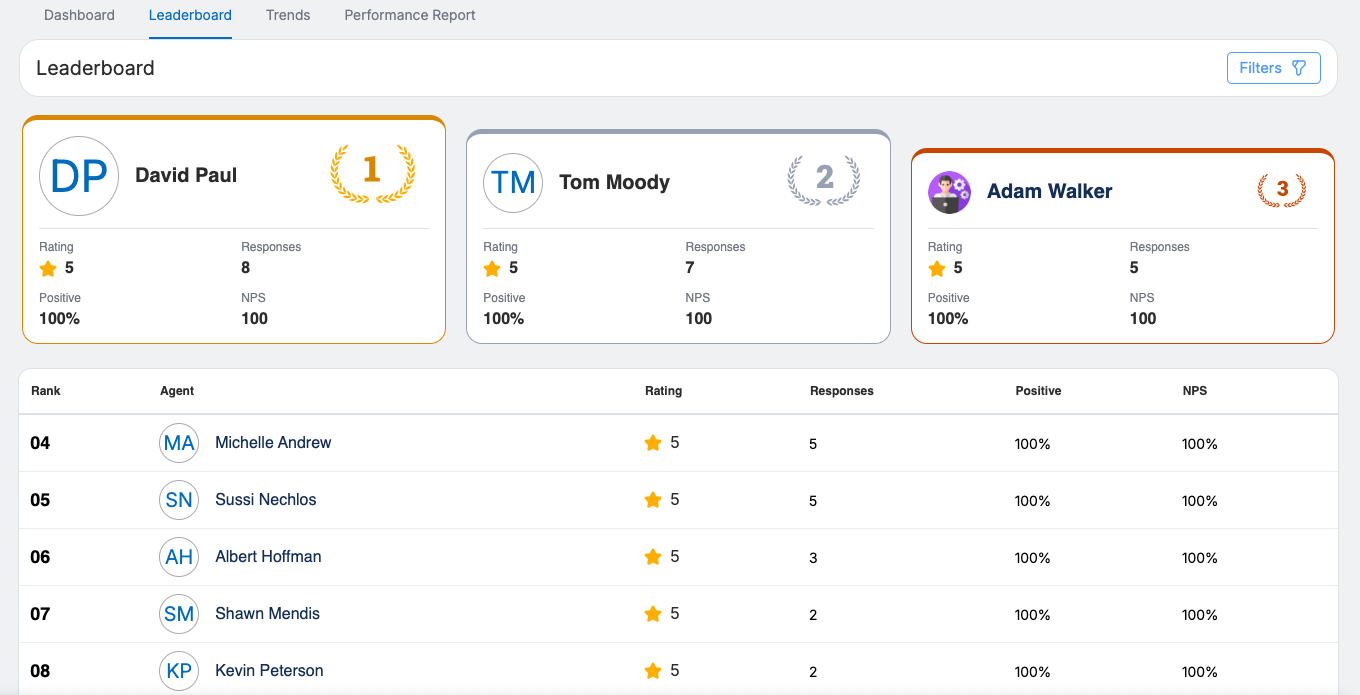
Leaderboard
-
Trends
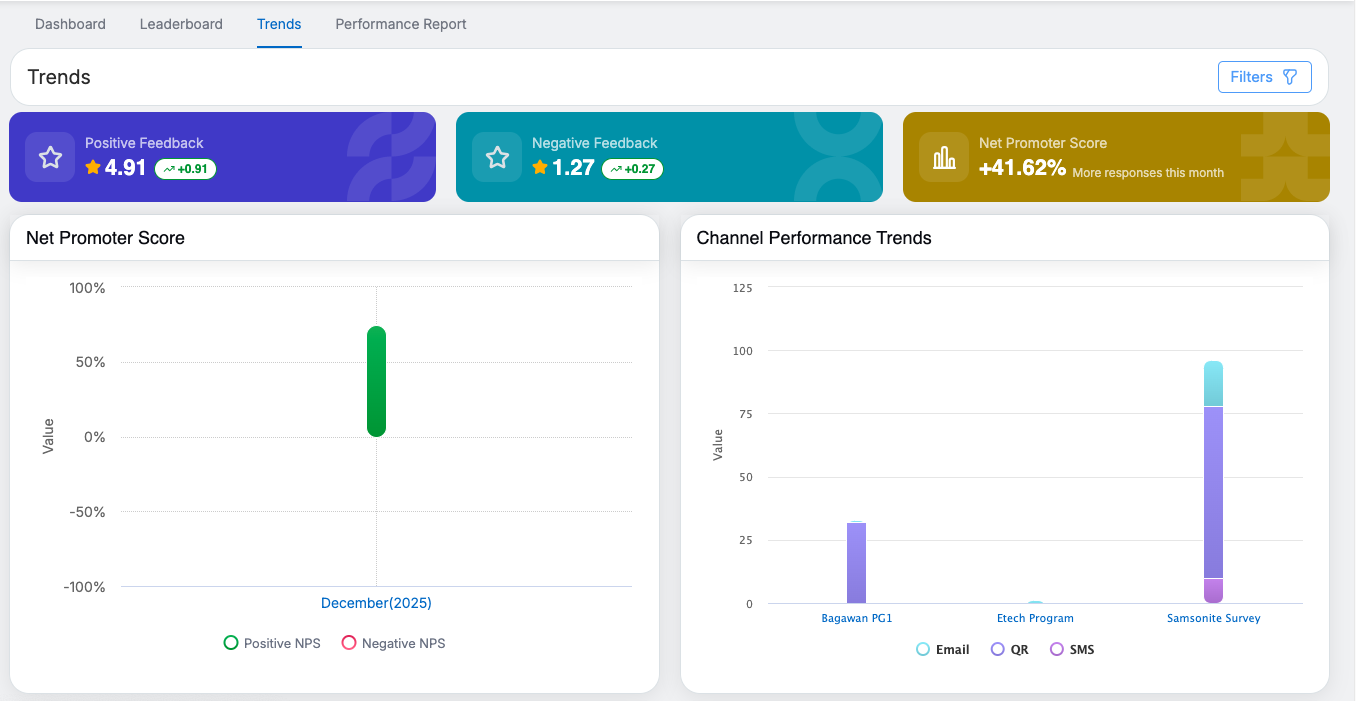
Trends
- Performance Reports
- Overview
- Channels
- Tags
- Brands
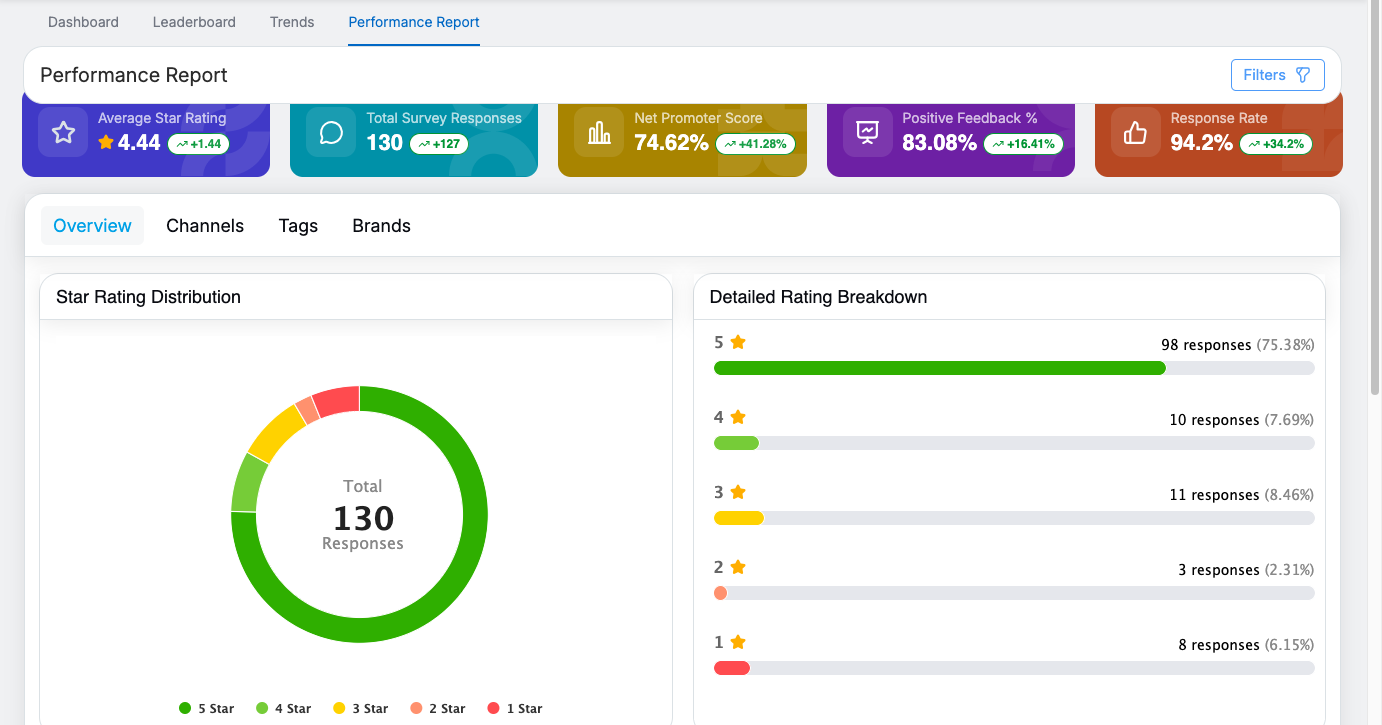
Performance Report
Key Capabilities
- Interactive visualisations (charts, graphs, ratings)
- Multi-select and checkbox-based filters
- Drill-down navigation across multiple levels
- Standardised color coding and legends
- Combined visibility of Call Centre and Repair Centre survey data
Access Control
Only users with Survey roles and access rights can view:
- Survey Dashboard
- Leaderboard
- Trends screen
- Performance Reports
Video