Table of Contents
- Introduction
- VP Home Page
- Dashboard
- Program QA Performance
- Overall QA Scores – Program
- Centrical Dashboard
Introduction
The Vice President (VP) user role provides access to the Reports module only. Users with this role can view reports based on the permissions assigned to them.
When a user logs in using a valid VP user ID and password, the system redirects them to the following screen.
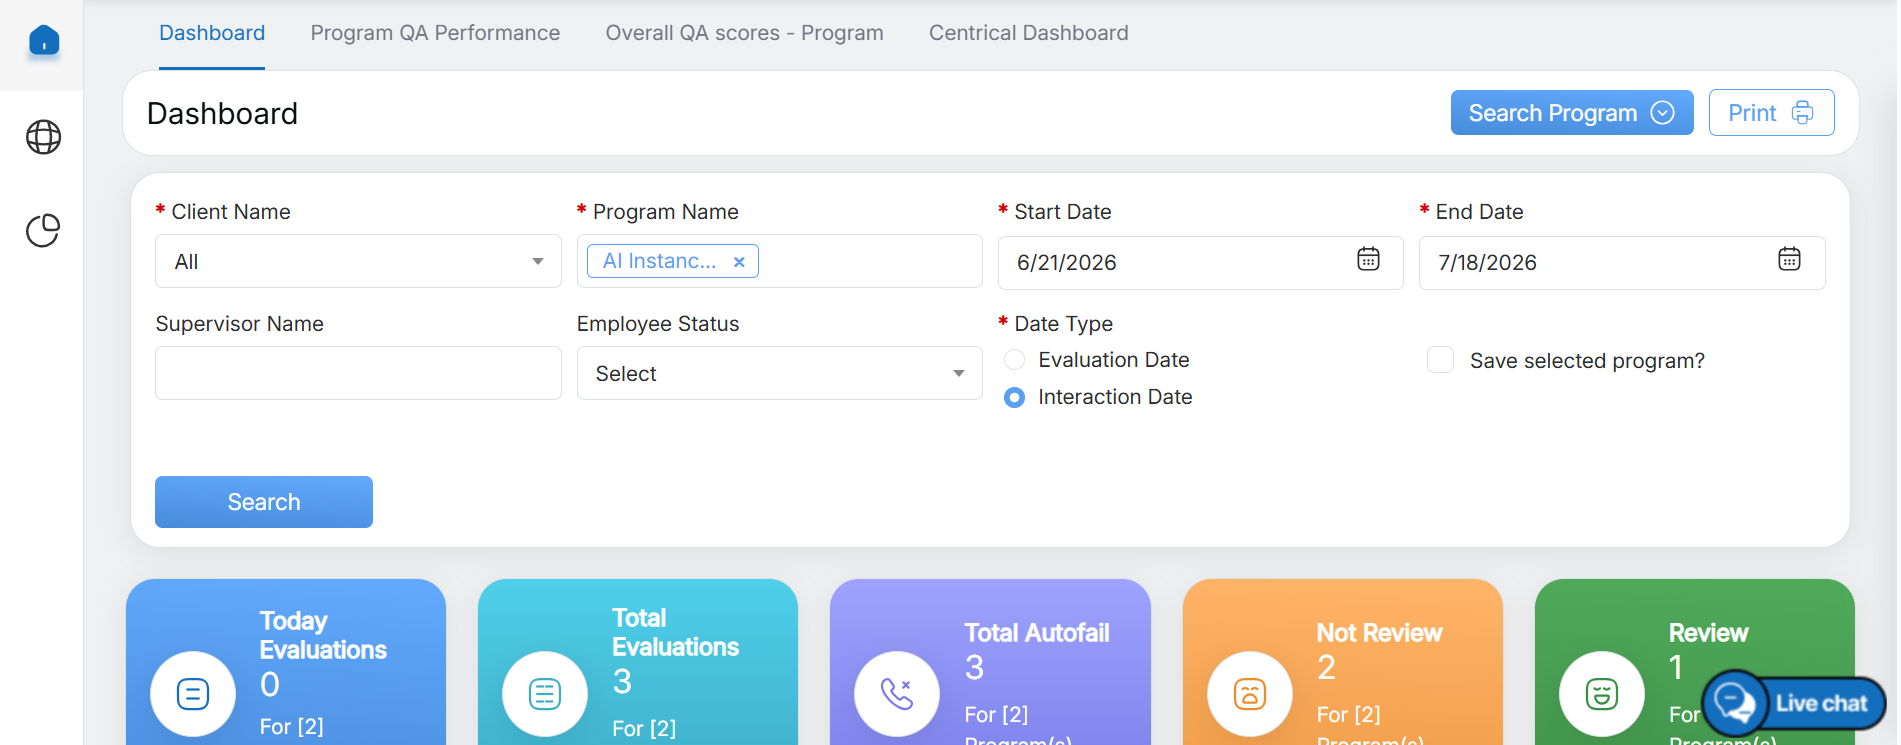
Dashboard
The VP console includes operational tabs like – Home, My Universe, Reports.
Note: The above-mentioned tabs are based on access rights. Admin can assign separate rights to the individual users. To know about the access rights of the Vice President (VP), refer to Users Access Control.
VP Home Page
VP will have access to six main tabs on the home page:
- Dashboard
- Program QA Performance
- Overall QA Scores – Program
- Centrical Dashboard
Dashboard
Dashboard
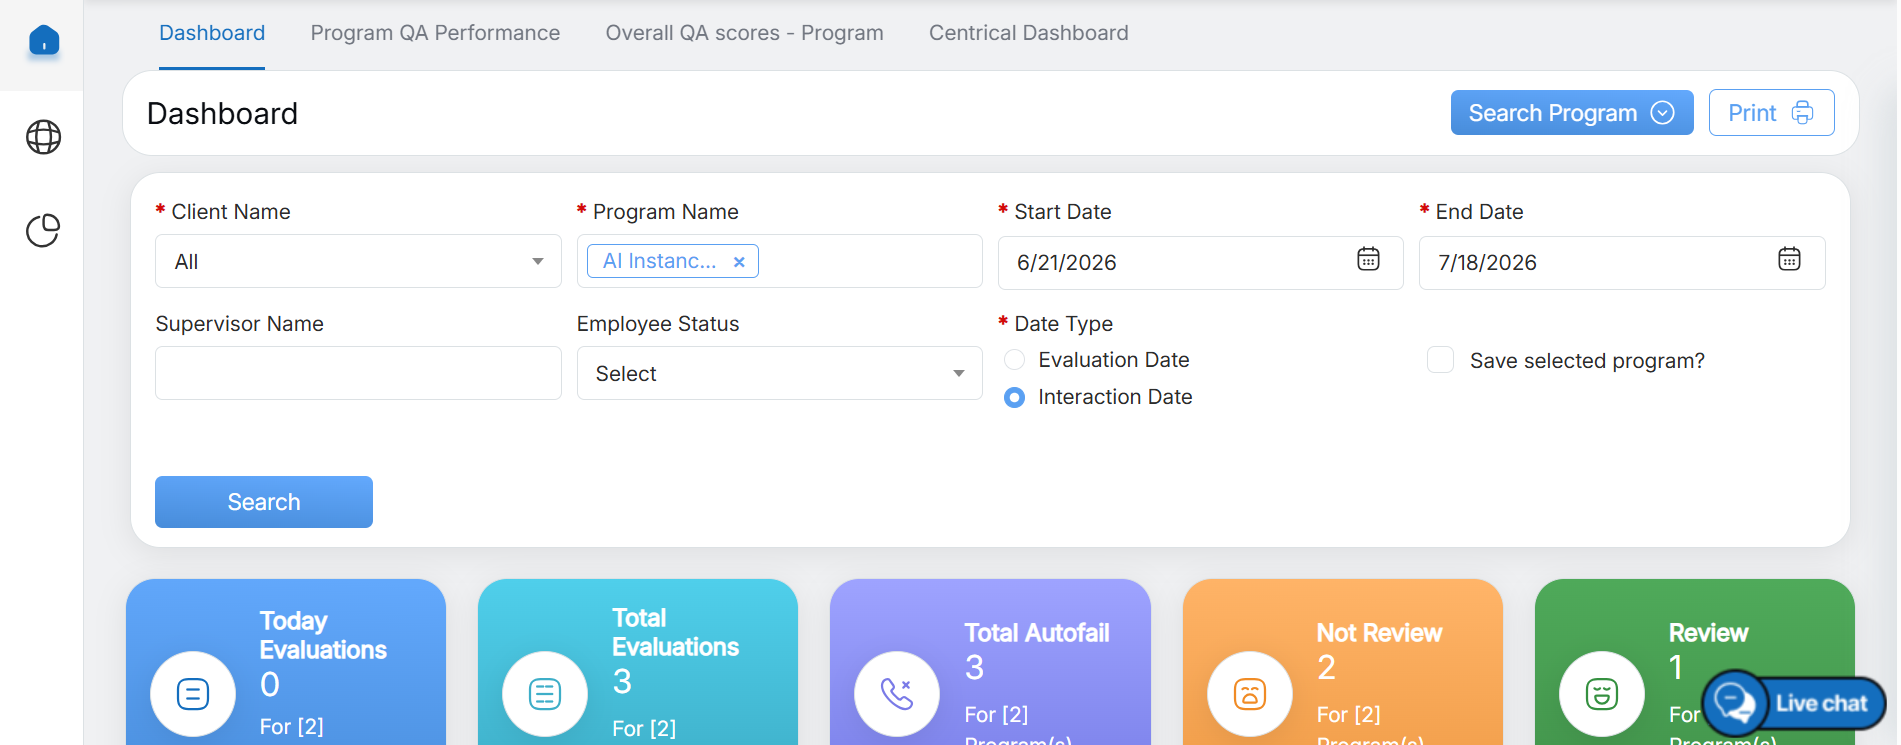
After logging in successfully, the Dashboard is displayed, as shown in the screen below.
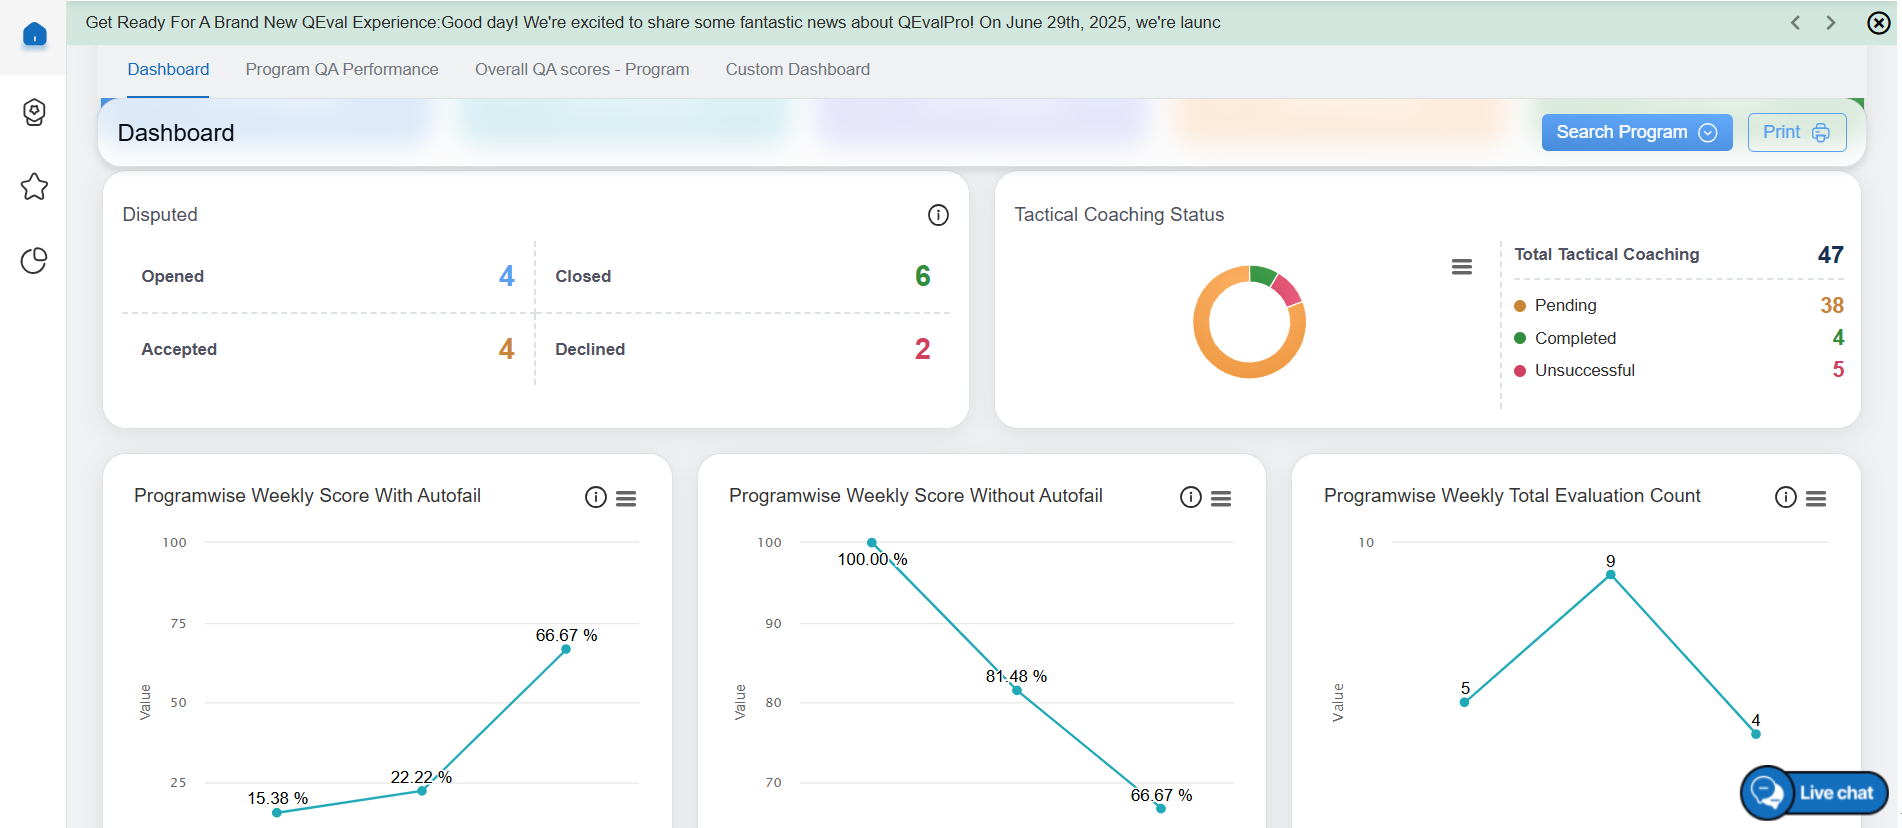
The dashboard displays various charts, graphs, and performance metrics. Scroll down the page to view additional analytics and statistics presented from different perspectives.
Analytical Data
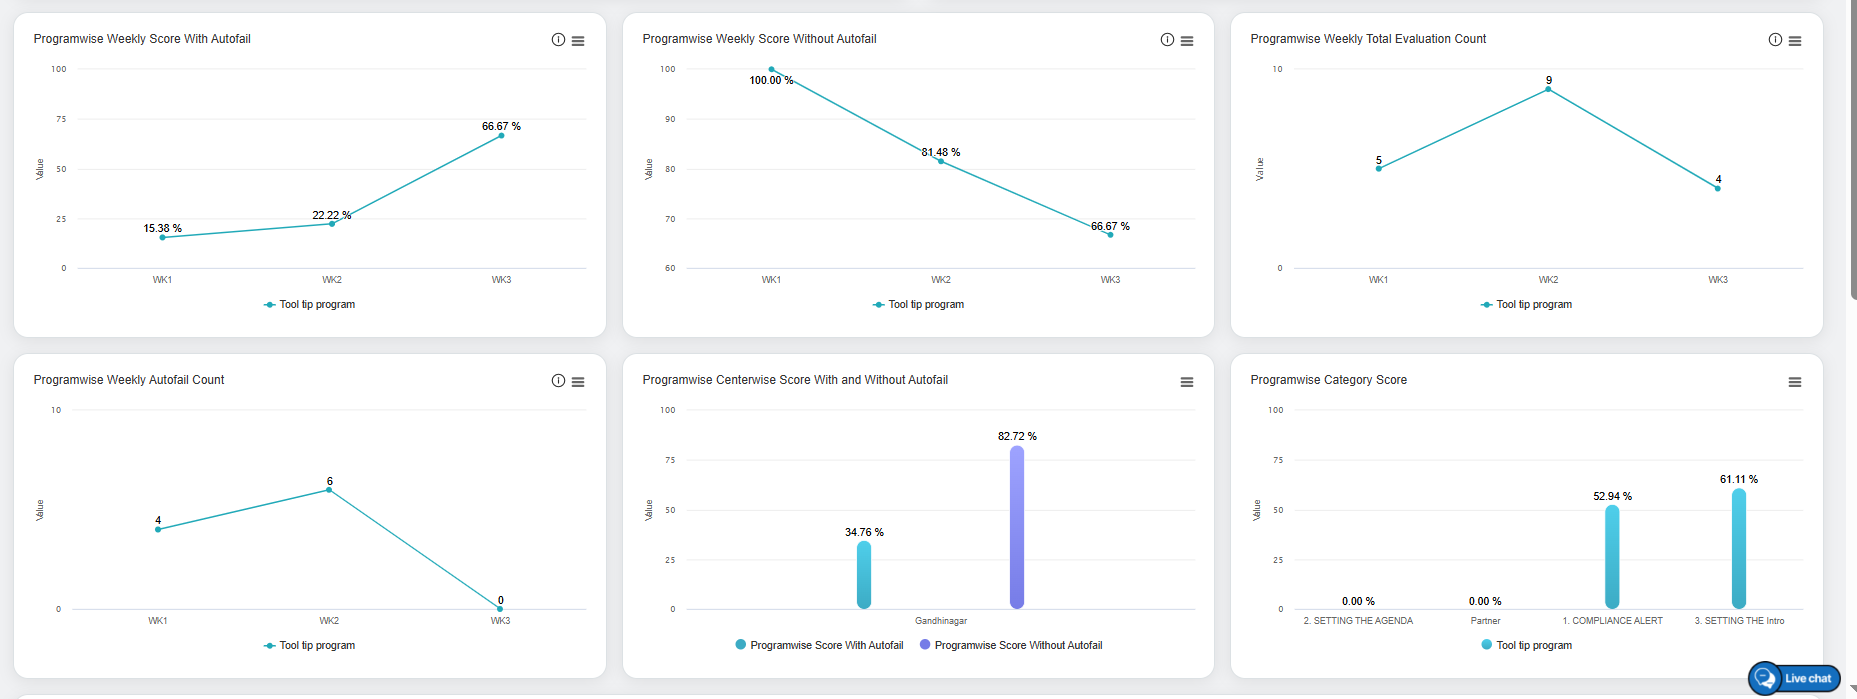
The dashboard presents data in a variety of graphical formats, including Doughnut Charts, Line Charts, Bar Graphs, and other visualizations.
Graphical Representation
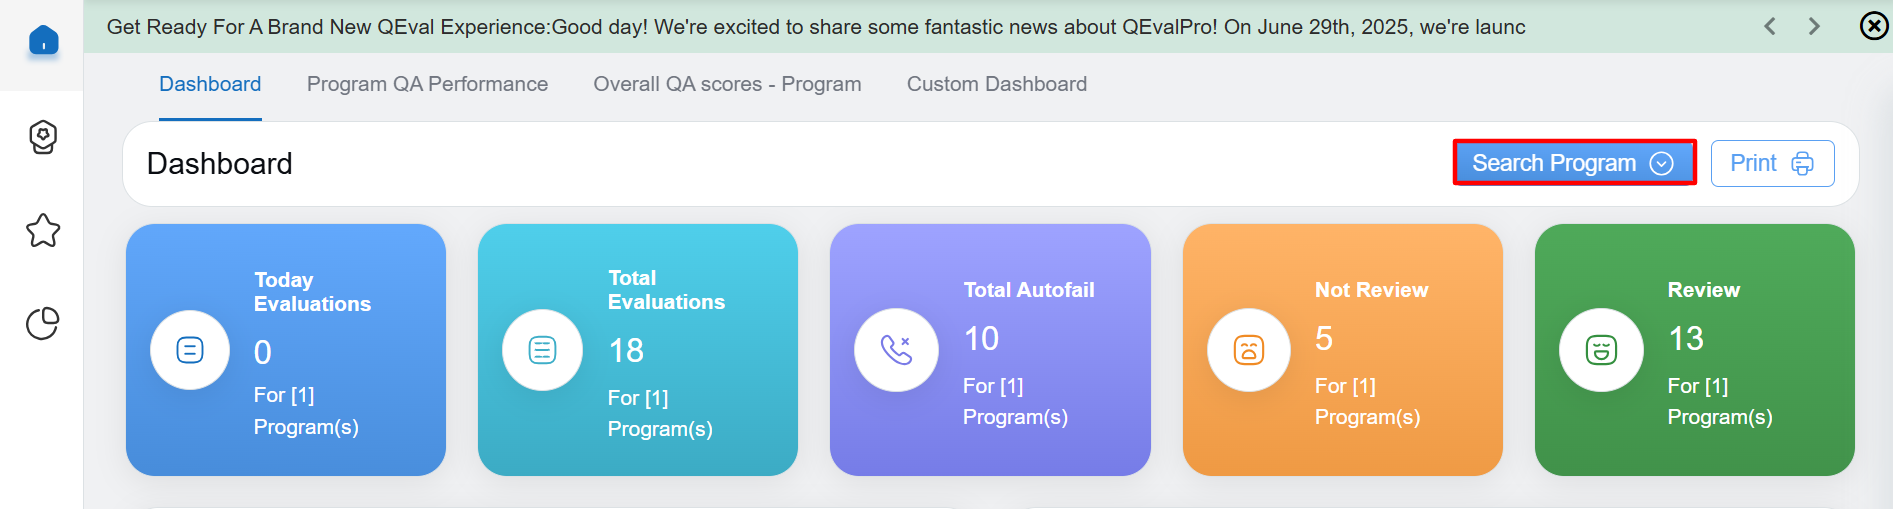
To view dashboard data for a specific program or criteria, use the Search Program filter.
Click Search Program on the dashboard, as shown in the screen below.
The Search Program window will open, allowing you to select the required search criteria before generating the dashboard data.
Search Program
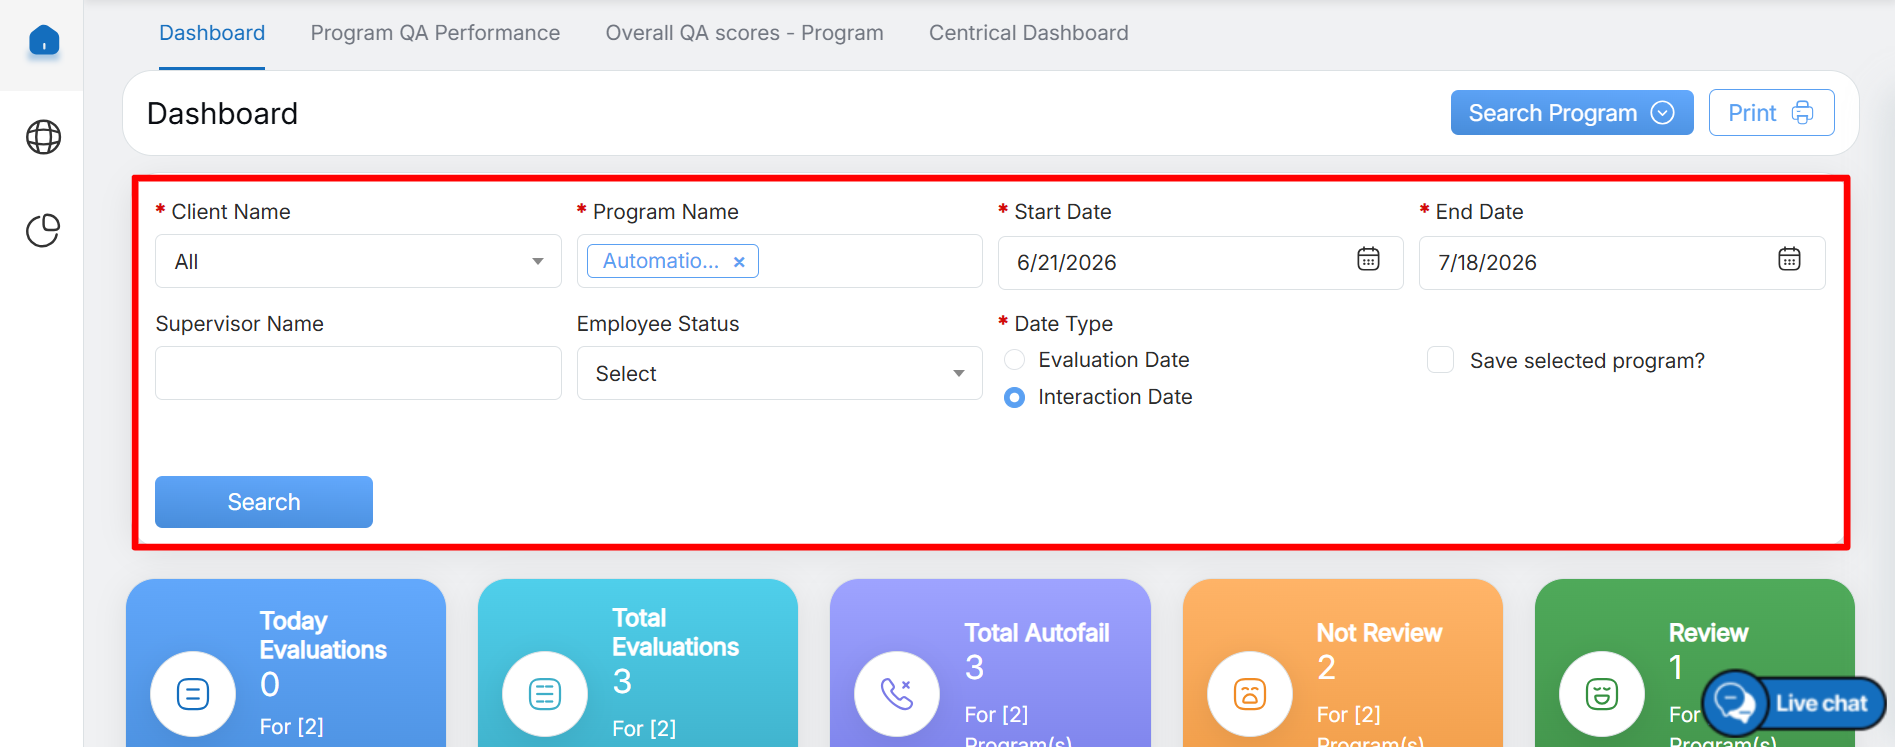
In the Search Program window, select the required search criteria to filter the dashboard data.
You can specify the following details:
- Client Name
- Program Name
- Start Date and End Date
- Supervisor Name
- Employee Status
- Date Type (Evaluation Date or Interaction Date)
If you want the system to remember the selected program for future searches, select the Save Selected Program checkbox.
After configuring the required search criteria, click Search. The dashboard will display data based on the selected filters.
Search Program Details
After clicking Search, the dashboard displays data based on the selected search criteria.
Users with the VP role can view and compare performance data across multiple programs, centers, and categories simultaneously.
The following reports will be displayed on this page:
|
Dashboard Elements |
Description |
|
Today’s Evaluation |
Displays the evaluation for the current day. |
|
Total Evaluation |
Displays the total evaluation for the specified date range. |
|
Total Autofail |
Displays the total autofail for the specified date range. |
|
Review |
Displays the total number of evaluations that have been reviewed. |
|
Not Review |
Displays the total number of evaluations that have not been reviewed. |
|
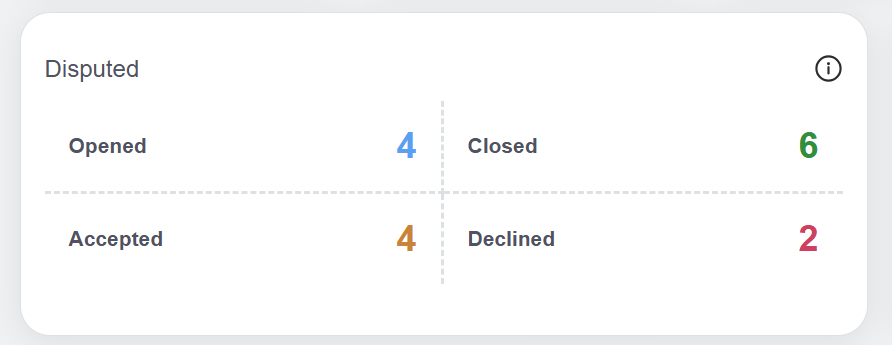
Disputed |
Displays the total number of disputes in the following states:
|
|
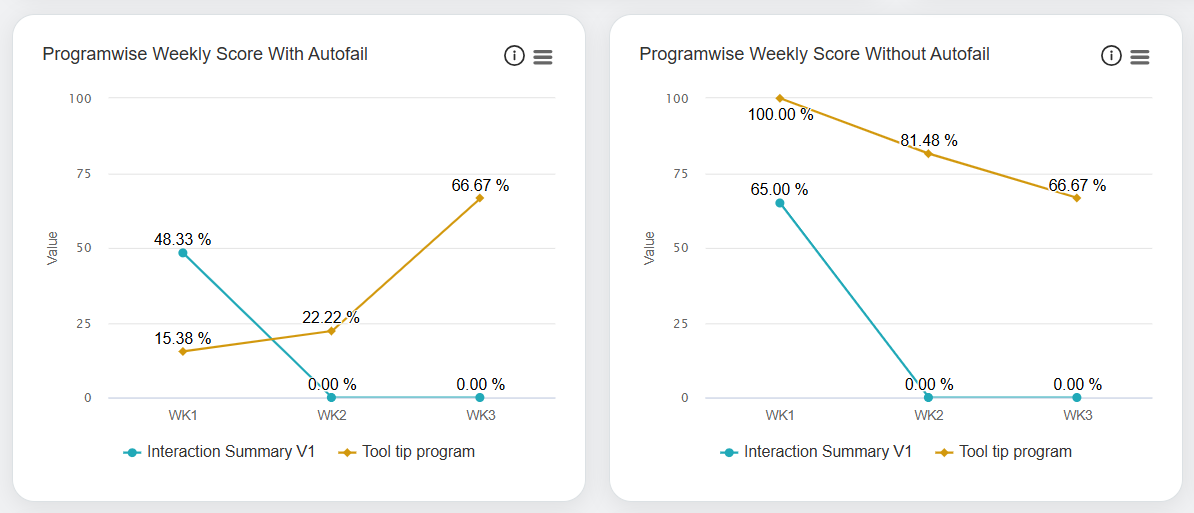
Programwise Weekly Score |
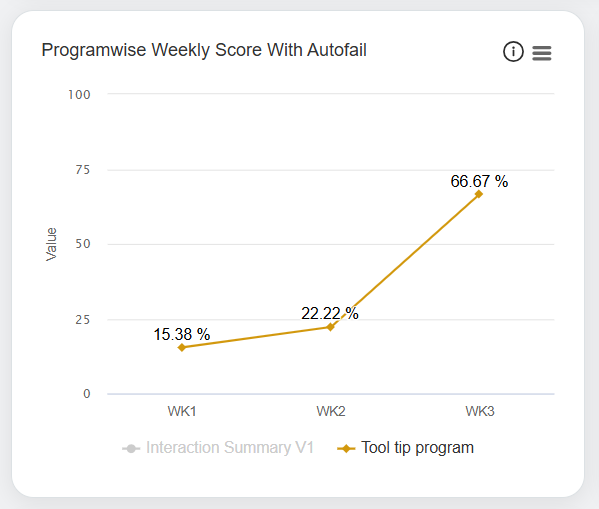
Displays weekly data for each program: These statistics are displayed in the Line Chart format. On these charts, the weekly score is displayed for each program.
Then, the statistics of only the selected program(s) will be displayed as shown below:
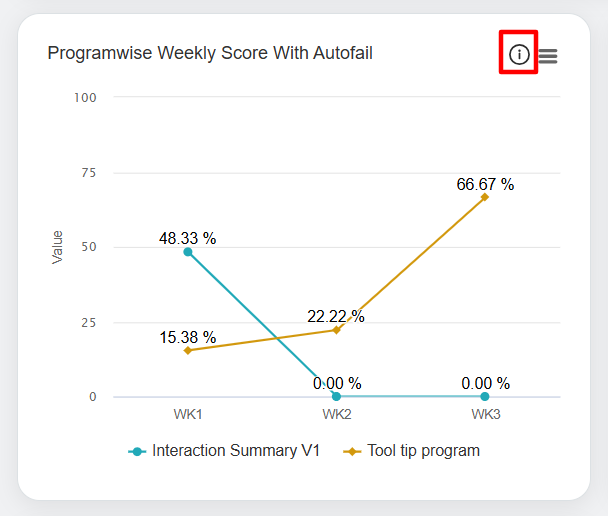
Similarly, VP can view the chart of the Weekly Score without Autofail for specific programs. To view the legends, click on the Legend For Week as shown below.
The Legend For Week window will be displayed as shown below:
|
|
Programwise Weekly Total Evaluation Count |
Displays the total evaluation count for the week through line graphs
These statistics are displayed in the Line Chart format. On these charts, the weekly count is displayed for each program.
Click on the program name(s) displayed below the chart to view the statistics of only that specific program(s) as shown below:
The Legend For Week window will be displayed as shown below:
|
|
Programwise Centerwise Score and Category Score |
Displays programwise scores for the centers through bar graphs
These statistics are displayed in the Bar Chart format. The following chart displays the statistics of both programwise scores achieved by the logged-in VP with and without the Autofail on a weekly basis for different centers.
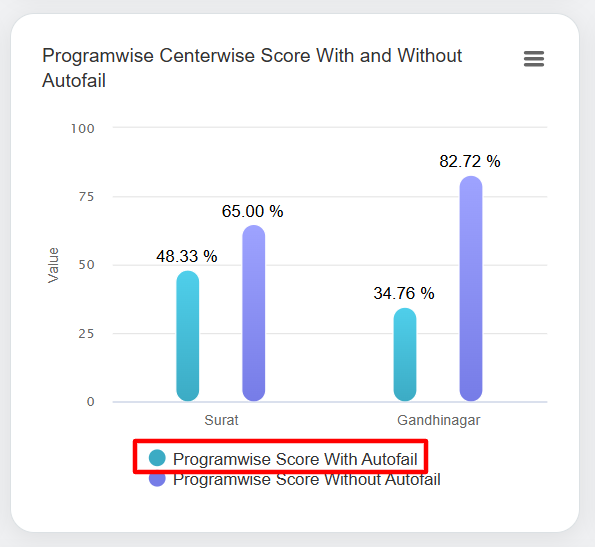
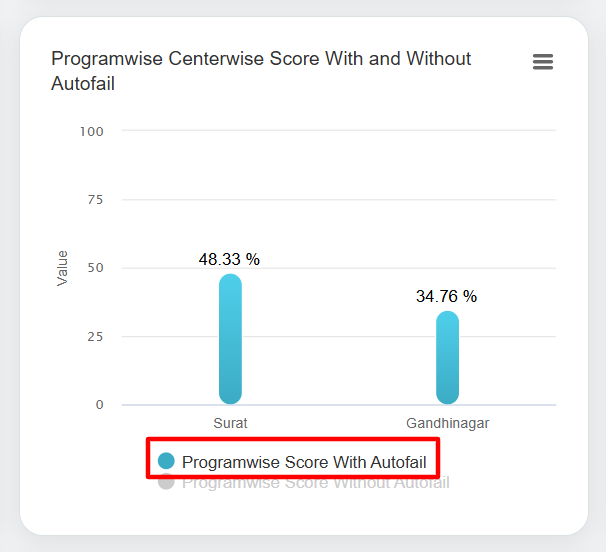
Click on the Programwise Score With Autofail displayed below to view the statistics of only scores with autofail.
The statistics of only scores with autofail achieved by the logged-in VP will be displayed:
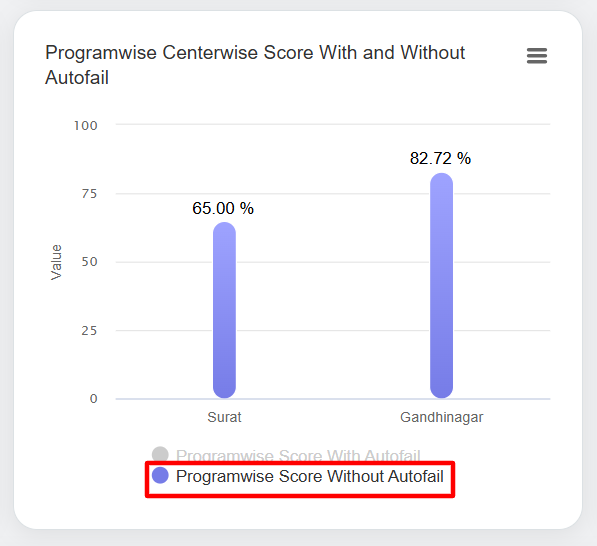
Similarly, click on the Programwise Score With Autofail and the statistics of only scores without autofail achieved by the logged-in VP will be displayed:
Similarly, one can view the Category Score report. |
|
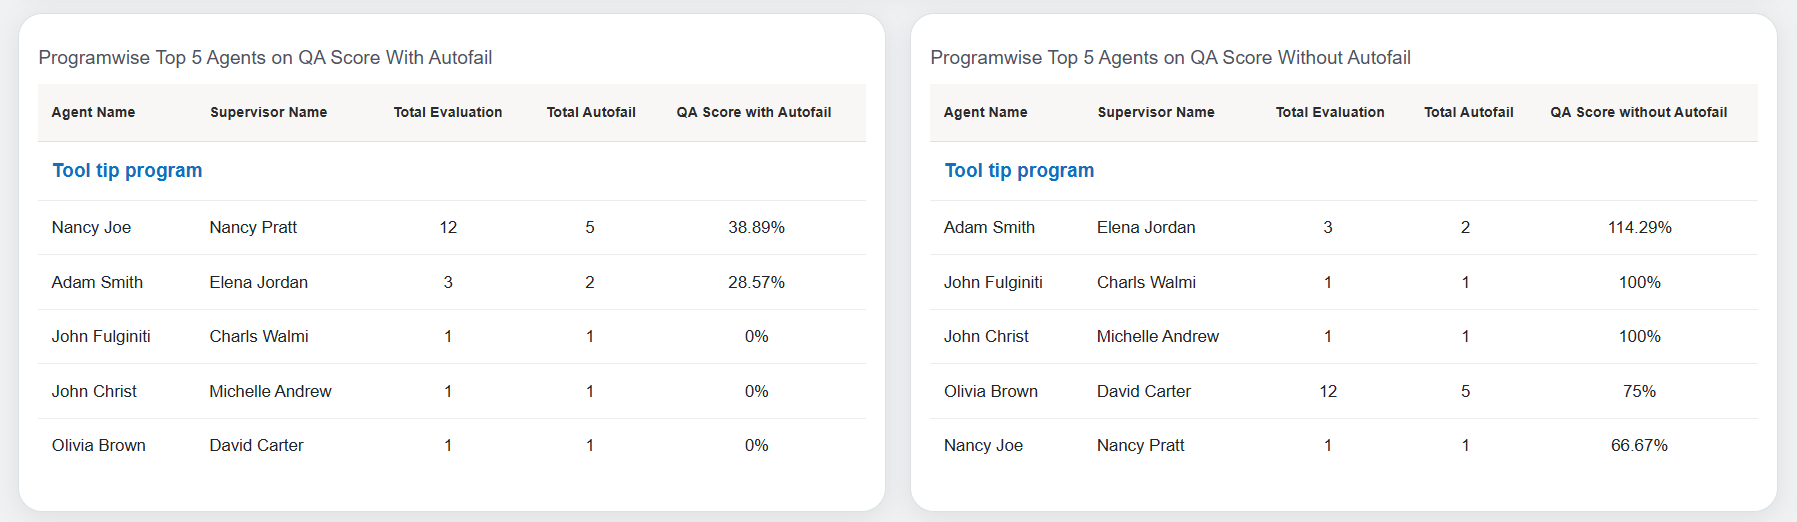
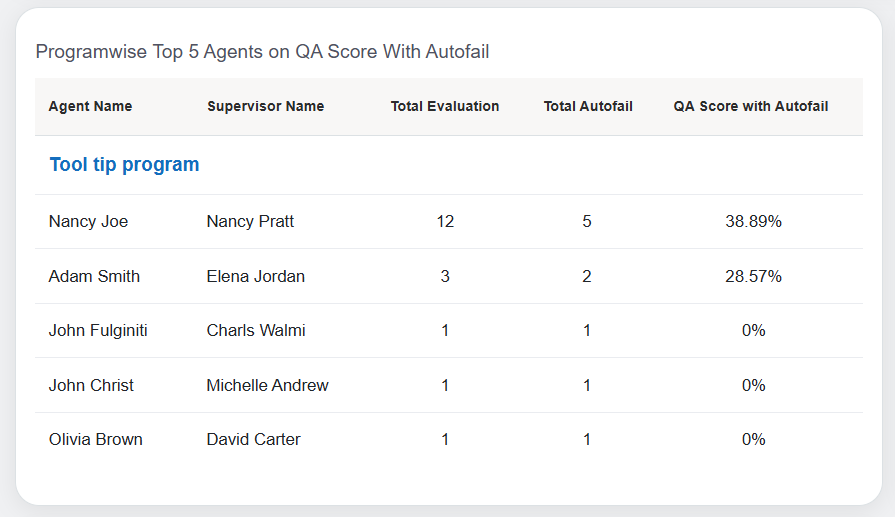
Programwise Top 5 Agents on QA score |
Displays the QA score for the top 5 agents in tabular form:
These statistics are displayed in the Table format. The following table displays the statistics of both programwise QA scores achieved by the top 5 performing agents with and without the Autofail on a weekly basis.
VP can view the QA scores for each program by clicking on the program name as shown below:
|
|
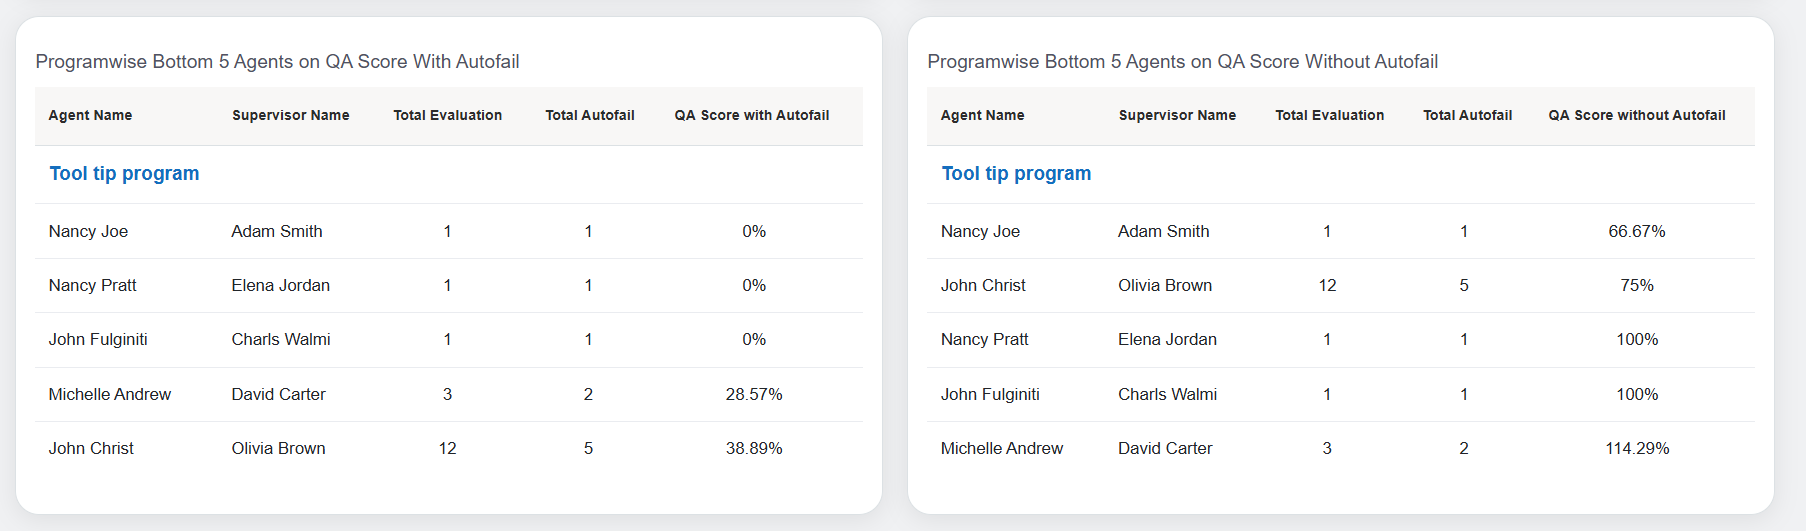
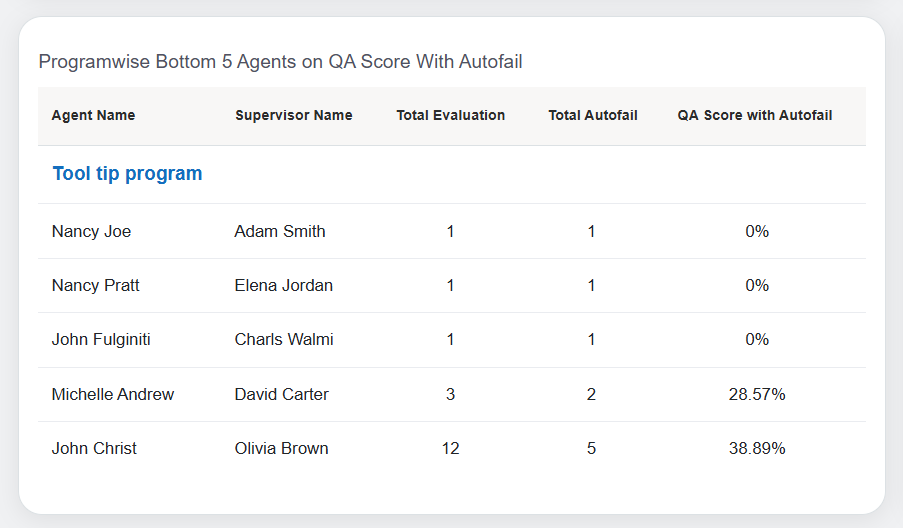
Programwise Bottom 5 Agents on QA score |
Displays the QA score for the bottom 5 agents in tabular form:
These statistics are displayed in Tabular format. The following table displays the statistics of both programwise QA scores achieved by the bottom (poor) 5 performing agents with and without the Autofail on a weekly basis.
VP can view the QA scores for each program by clicking on the program name as shown below:
|
| Tactical Coaching |
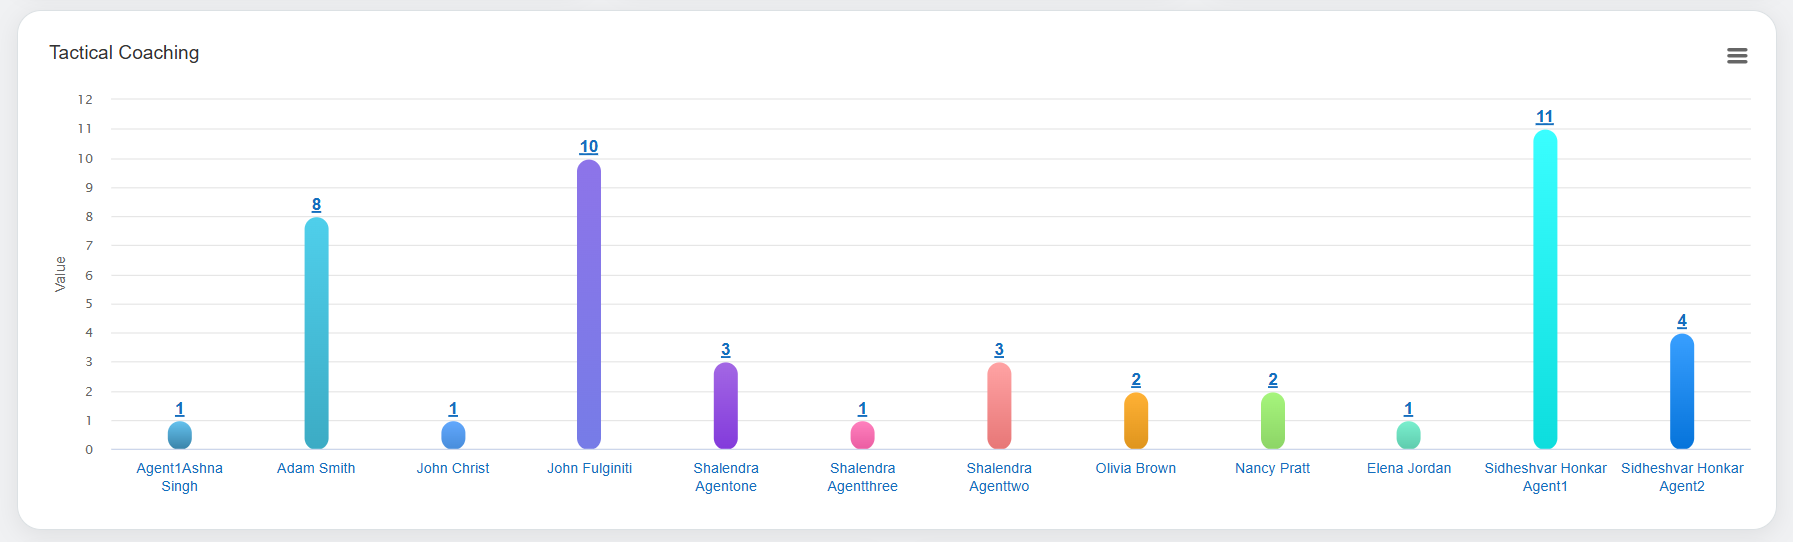
Tactical coaching graphs assist the logged-in user to access the comprehensive agent-level coaching data. These statistics are displayed in the Bar Chart format as shown below:
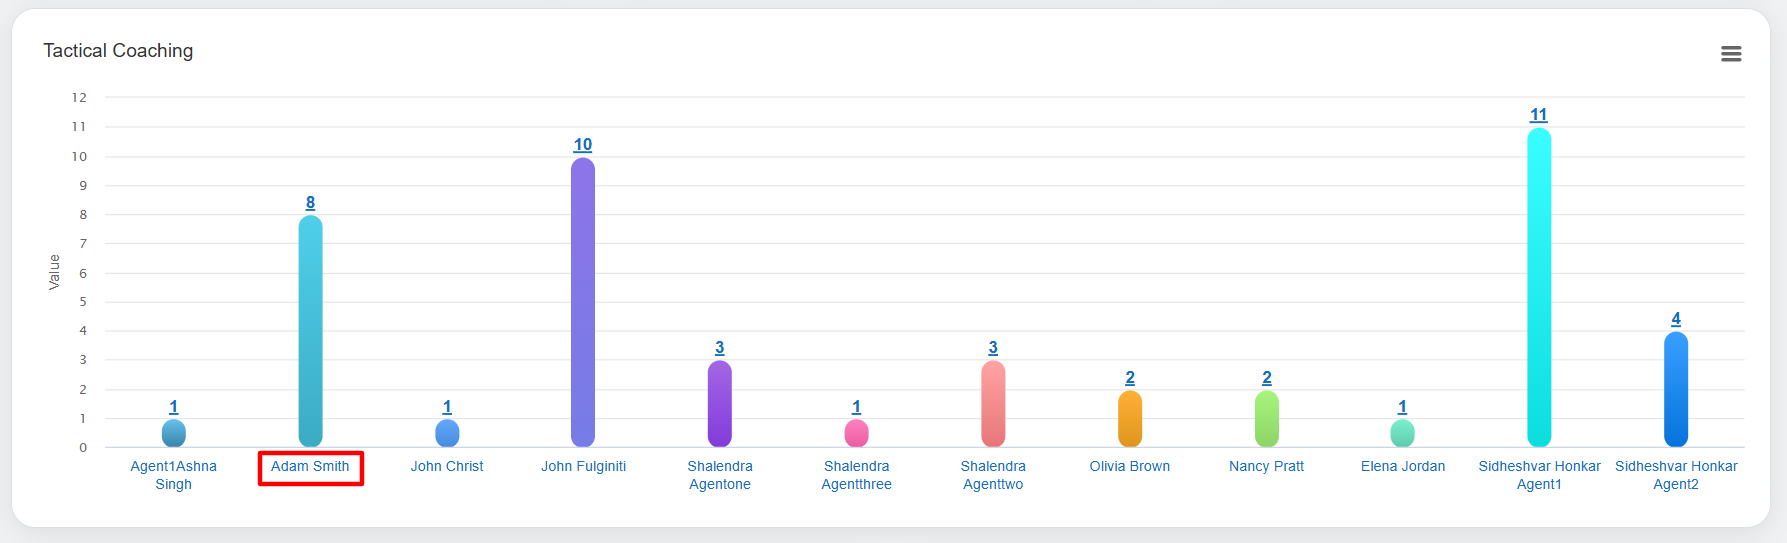
Click on the individual agent’s name displayed below the chart to view the status of only that specific agent as shown below:
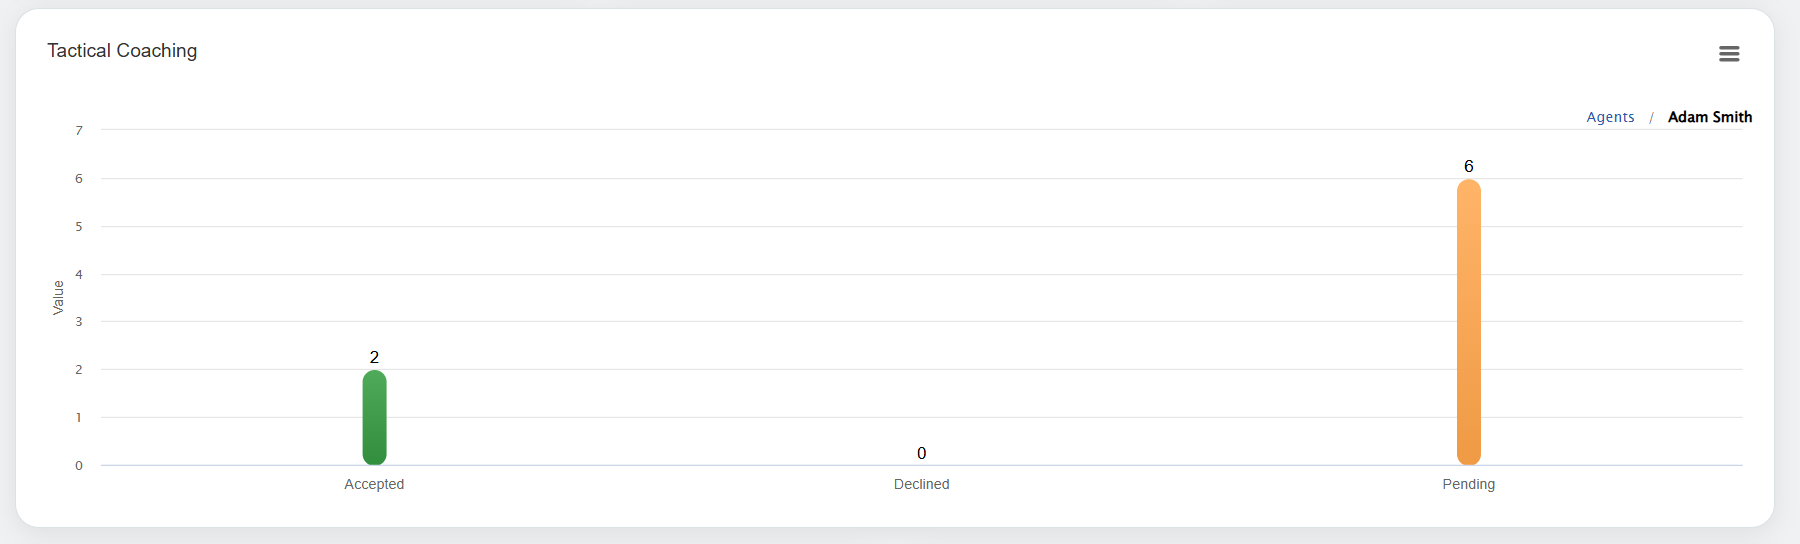
Then, the status of Accept, Decline, and Pending cases of that specific agent will be displayed as shown below:
|
| Tactical Coaching Status |
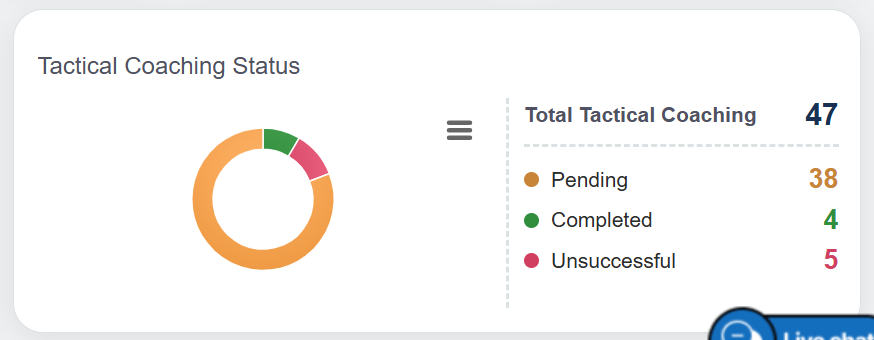
Tactical coaching status statistics are displayed in the Pie Chart format. On this chart, the user can view the number of completed, pending, and unsuccessful coaching status as shown below:
|
 Click on the program name(s) displayed below the chart to view the statistics of only that specific program(s) as shown below: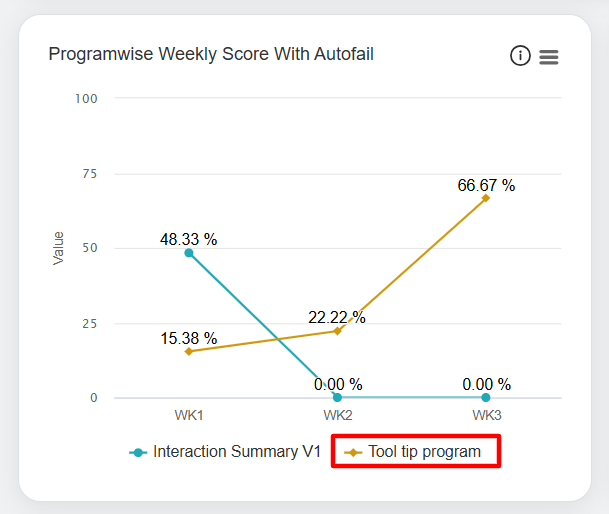
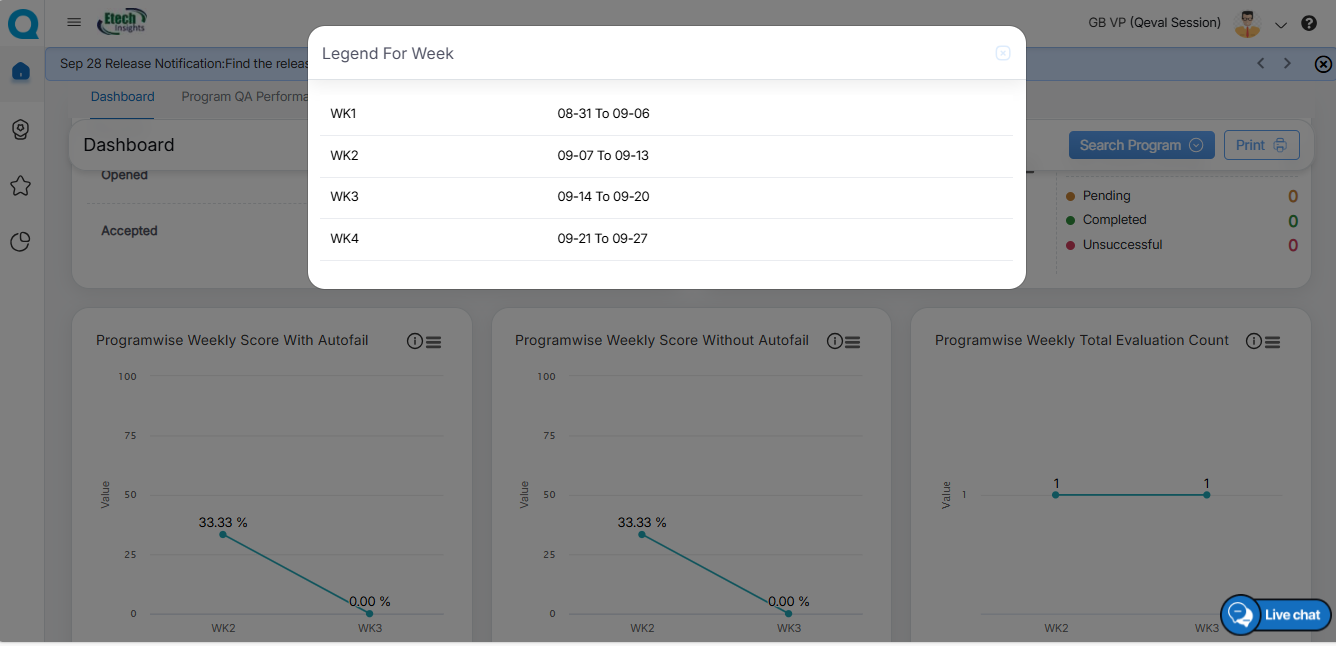 In this window, the date range of each week will be displayed for which the data is displayed for the Programwise Weekly Score with Autofail and Programwise Weekly Score without Autofail in the Line Chart format.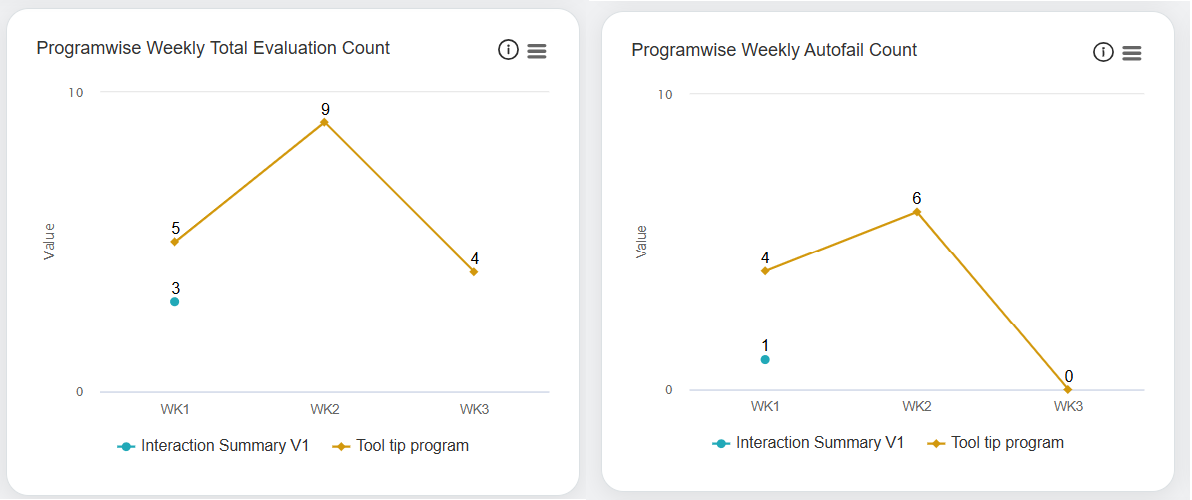
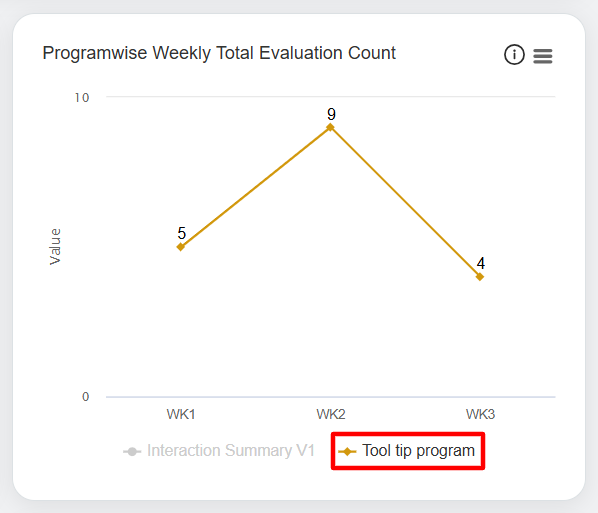 To view the legends, click on the Legend For Week as shown below.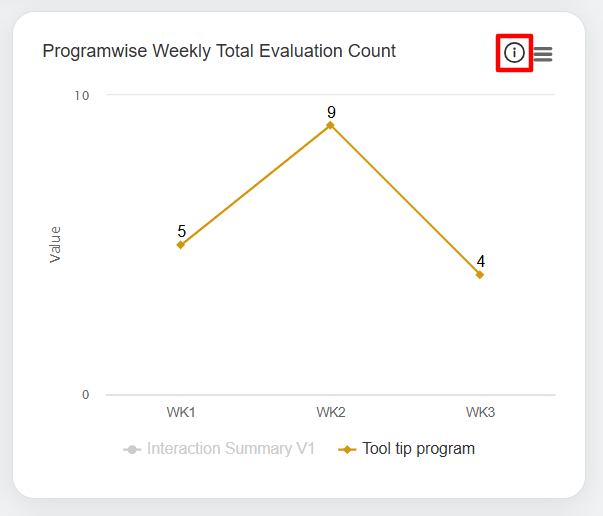
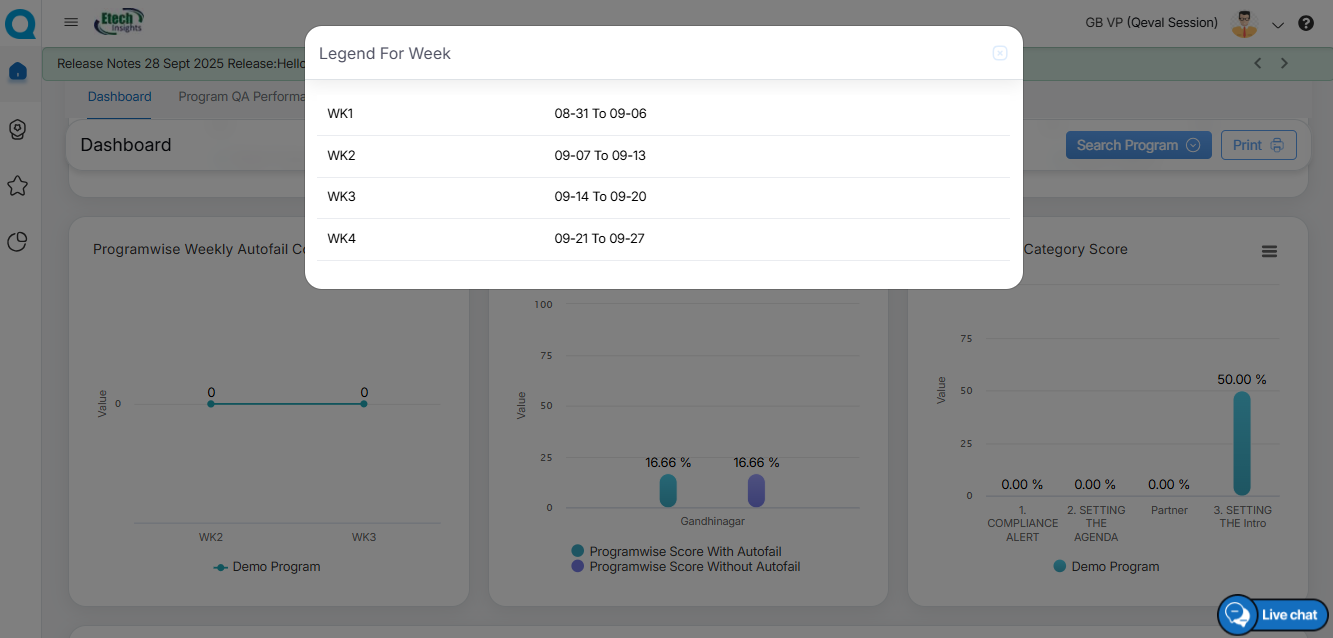 In this window, the date range of each week will be displayed for which the data is displayed for the Programwise Weekly Total Evaluation Count and Programwise Weekly Autofail Count in the Line Chart format.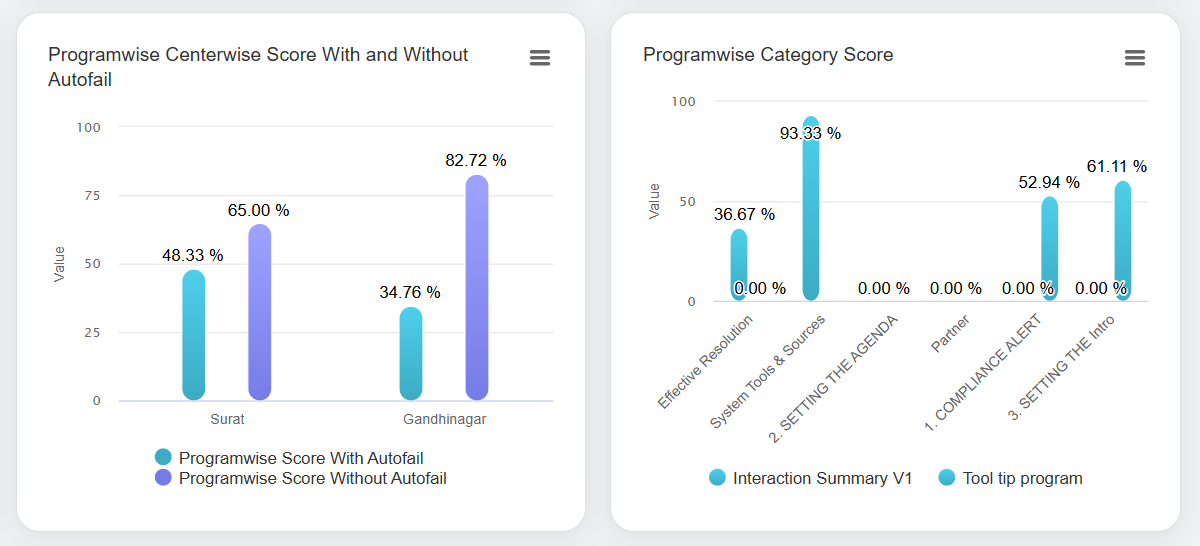
For each statistic displayed on the Dashboard, the logged-in VP can perform the following actions:
View the Statistics on Full Screen
The VP can view any dashboard chart in full-screen mode for better visibility.
To do so, click the Chart Context Menu icon on the required chart, as highlighted in the screen below.
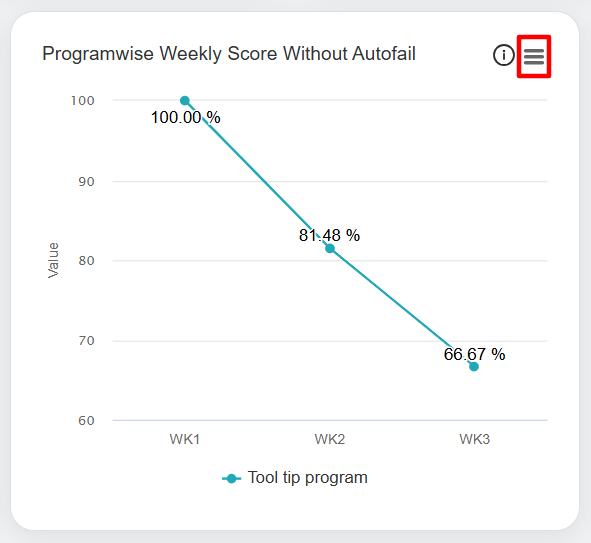
Context Menu
Click on the View in full screen option.
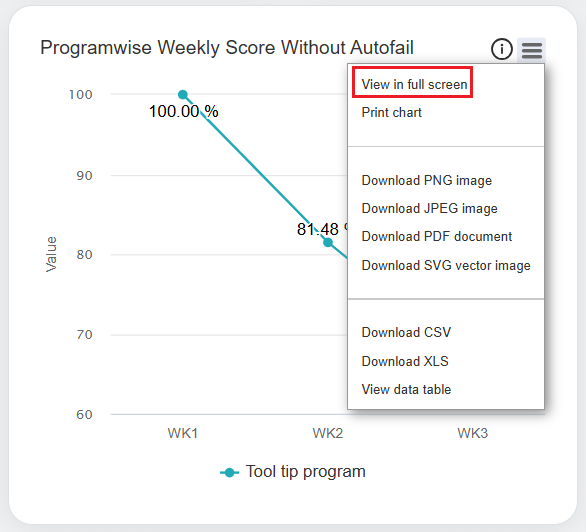
View in full screen
The data will be displayed in the full-screen mode as shown below:
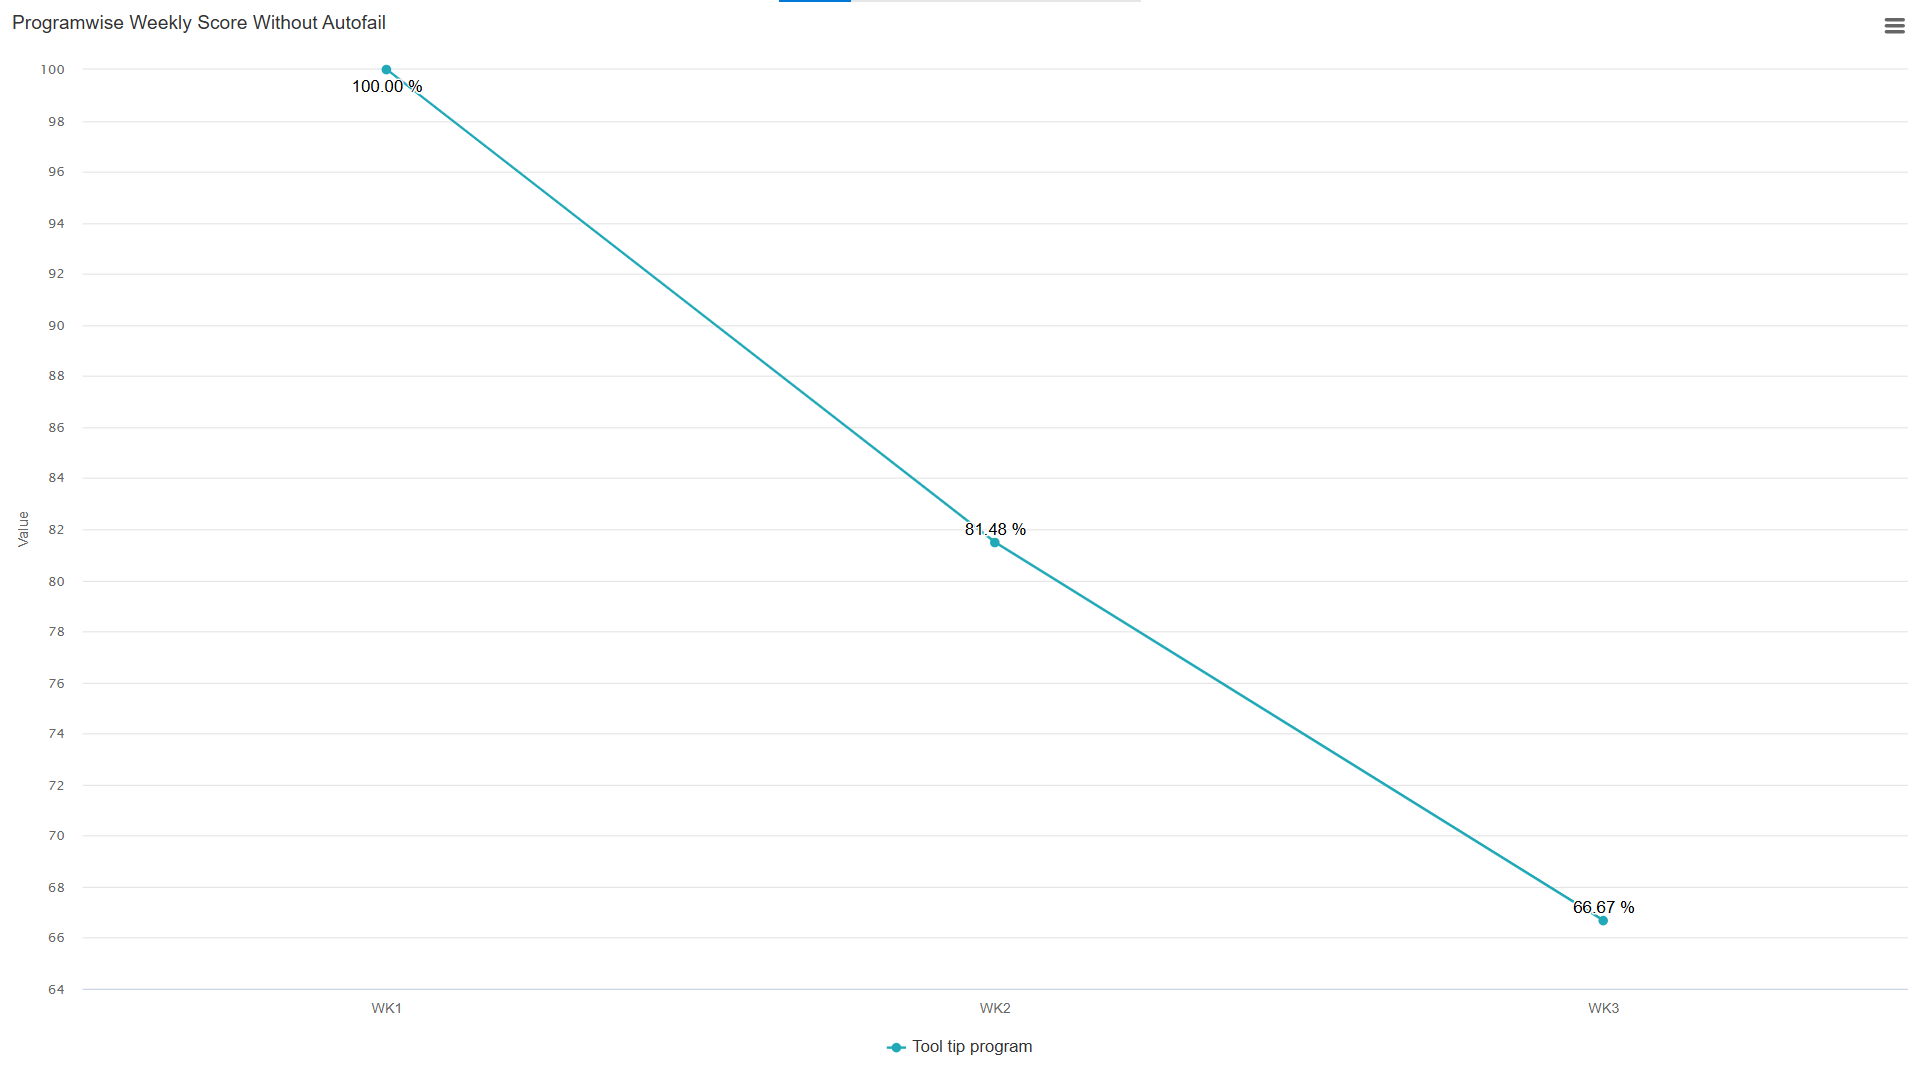
Full screen mode
To exit full-screen mode, click the Chart Context Menu icon and select Exit from Full Screen, as shown in the screen below.

Exit from full screen
Print Chart
The VP can print any chart and save it to the local system.
To do so, click the Chart Context Menu icon on the required chart and select Print Chart, as shown in the screen below.
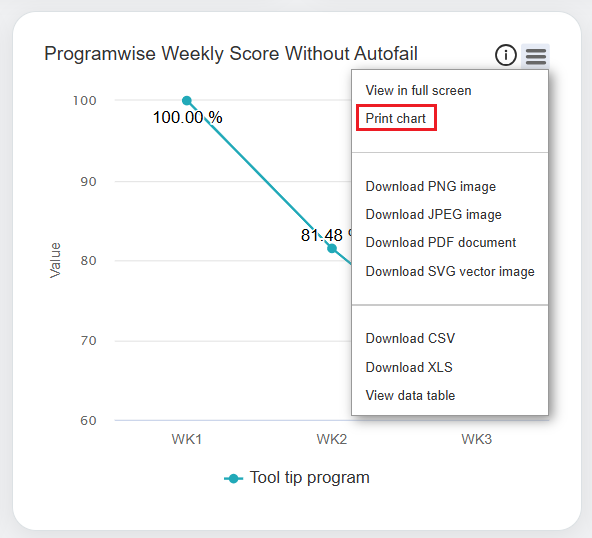
Print Chart
Download Chart
VP can download each chart/statistic displayed on the Dashboard in:
- PNG image
- JPEG image
- PDF document
- SVG vector image
Agents can also download the data in CSV and XLS format as well.
To download a chart, click the Chart Context Menu icon and select the desired download format as shown in the screen below.
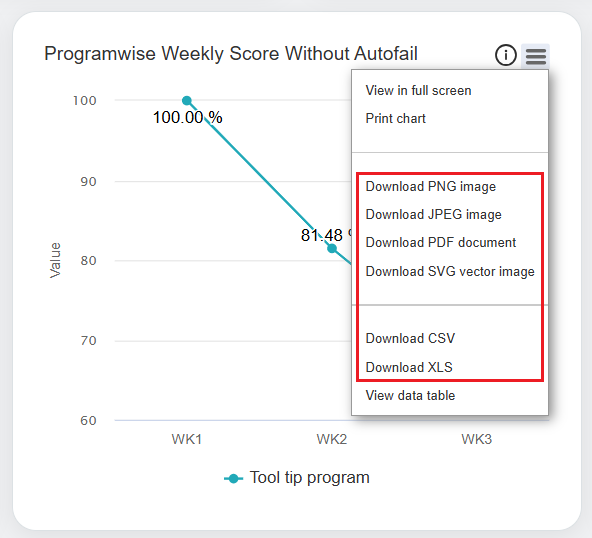
Download Formats
The particular information will be downloaded into the local system.
View Data Table
The VP can view chart data in a tabular format for easier analysis.
To view the data table, click the Chart Context Menu icon on the required chart and select View Data Table, as shown in the screen below.
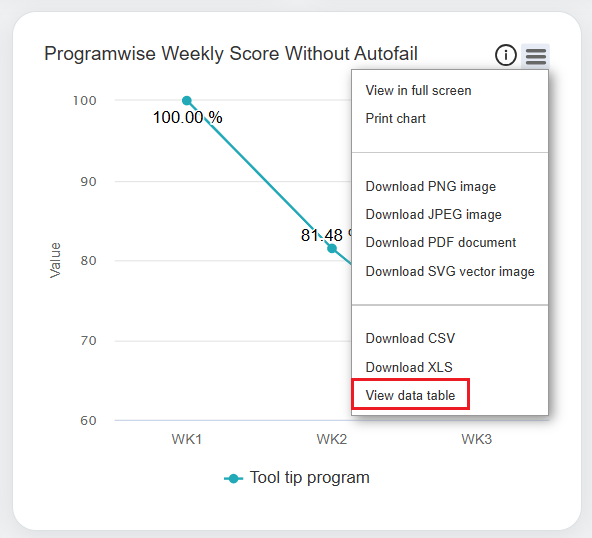
View data table
The data table will be displayed for the particular category as displayed below:
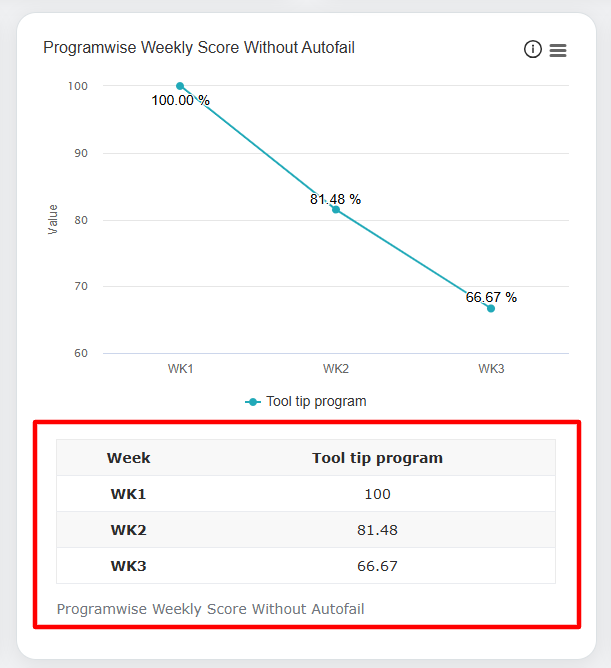
Details of data table
Program QA Performance
On the Program QA Performance page, the VP can view weekly quality performance data for both Voice Campaigns and Chat Campaigns.
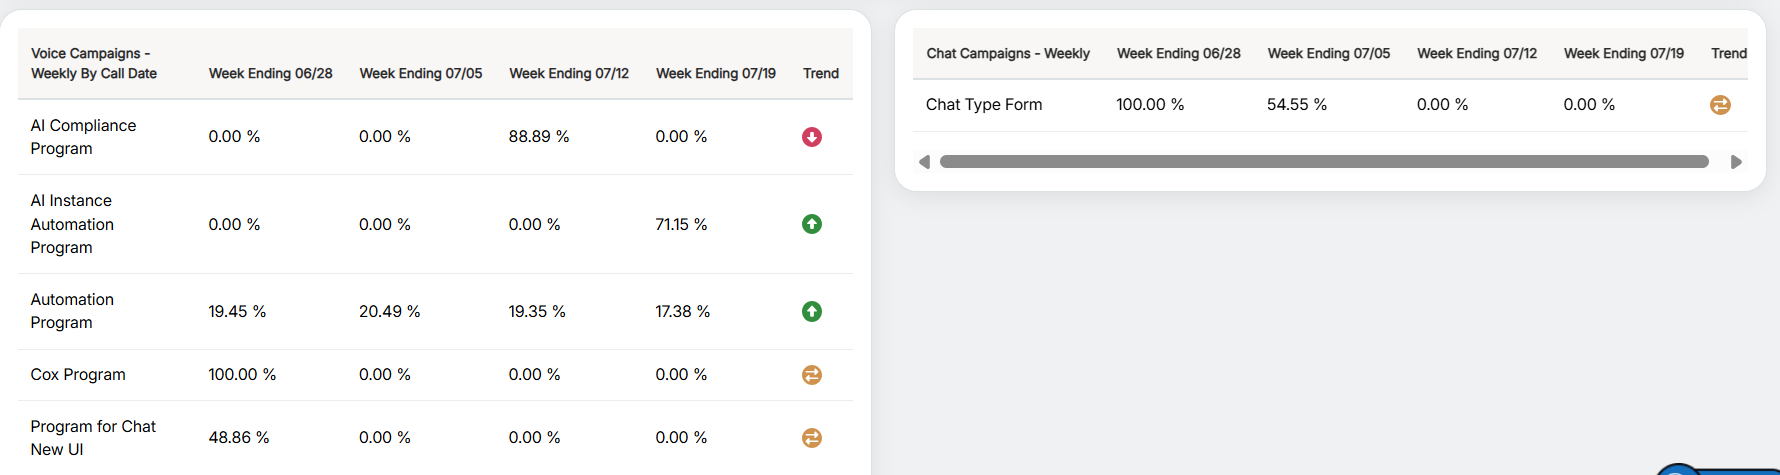
Program QA Performance for Voice and Chat Campaigns
The Program QA Performance report also includes a Trend column.
To filter the report by Employee Status, click the Filter button.
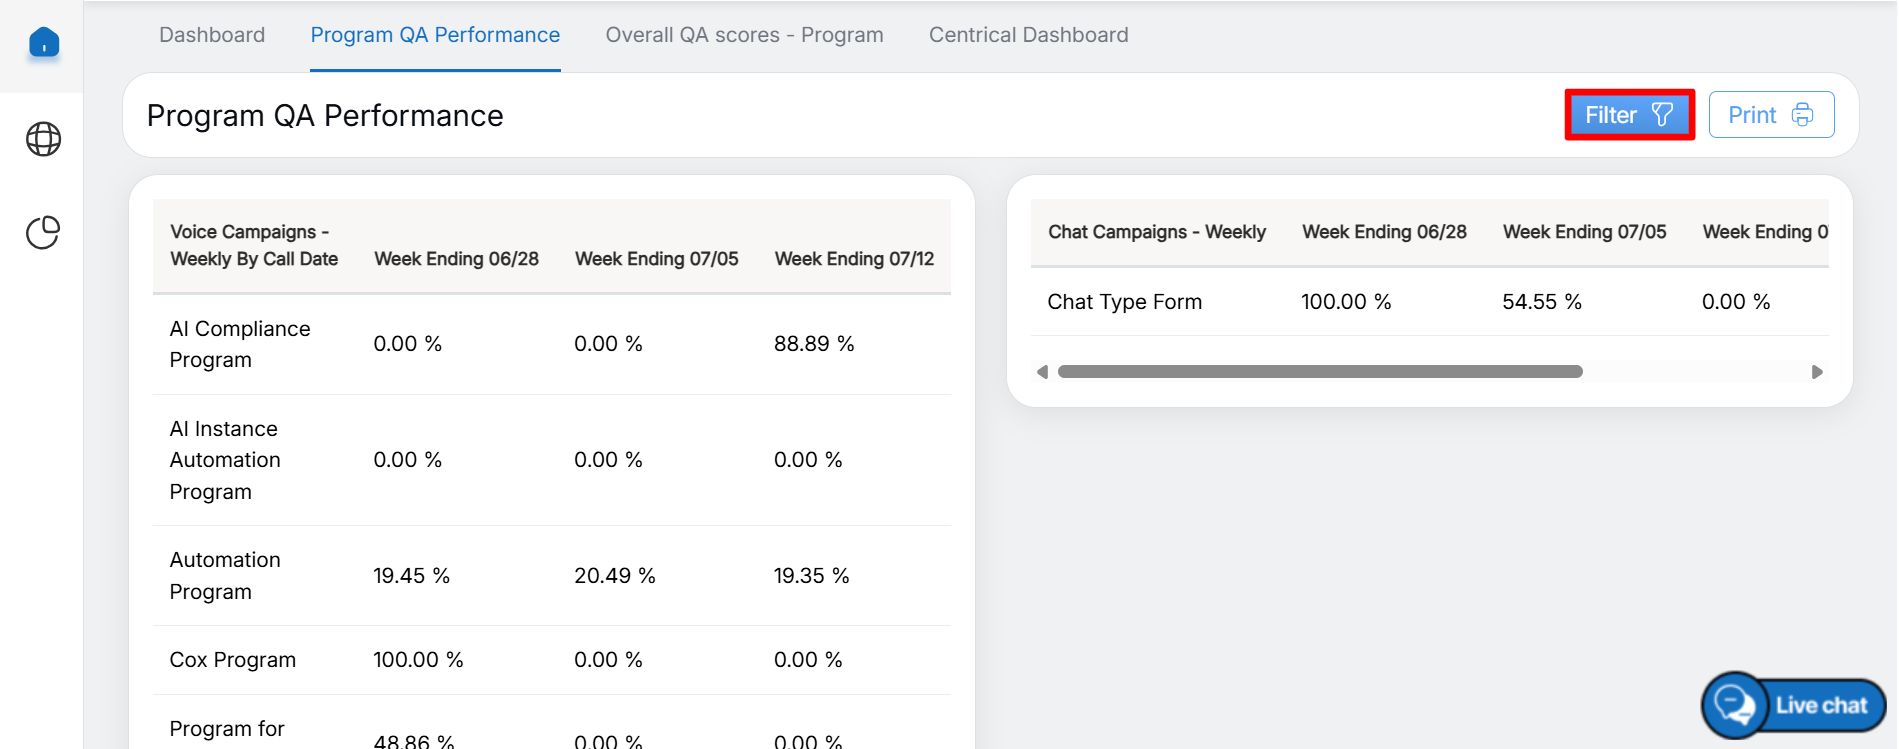
Filter
In the Employee Status drop-down list, select the required status, and then click Search.
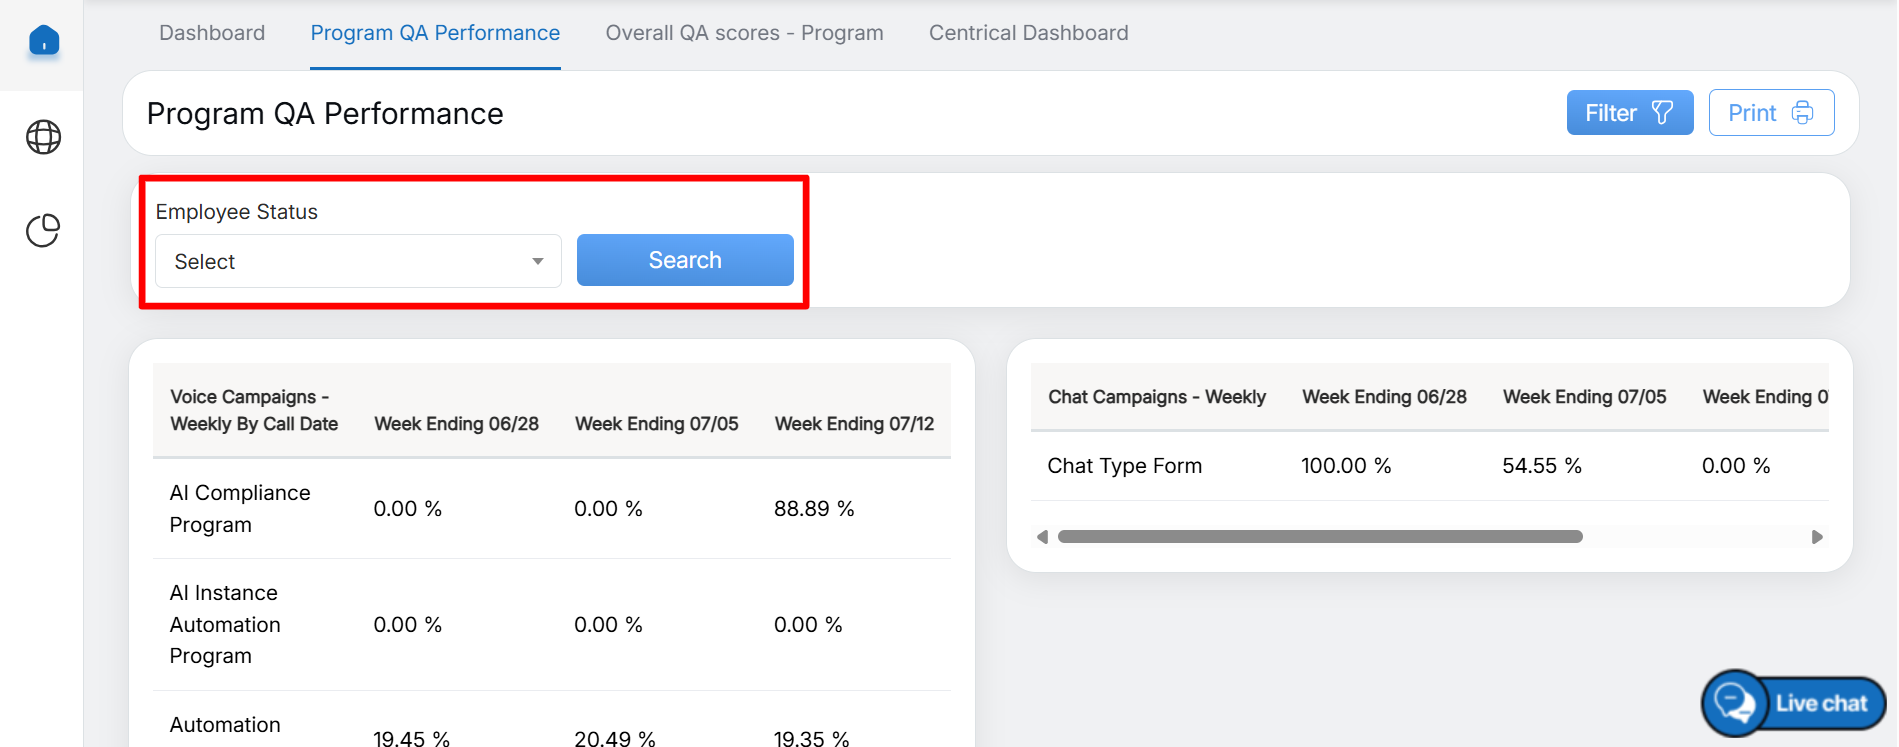
Employee Status Dropdown
To print the report, click the Print button, as shown in the screen below.
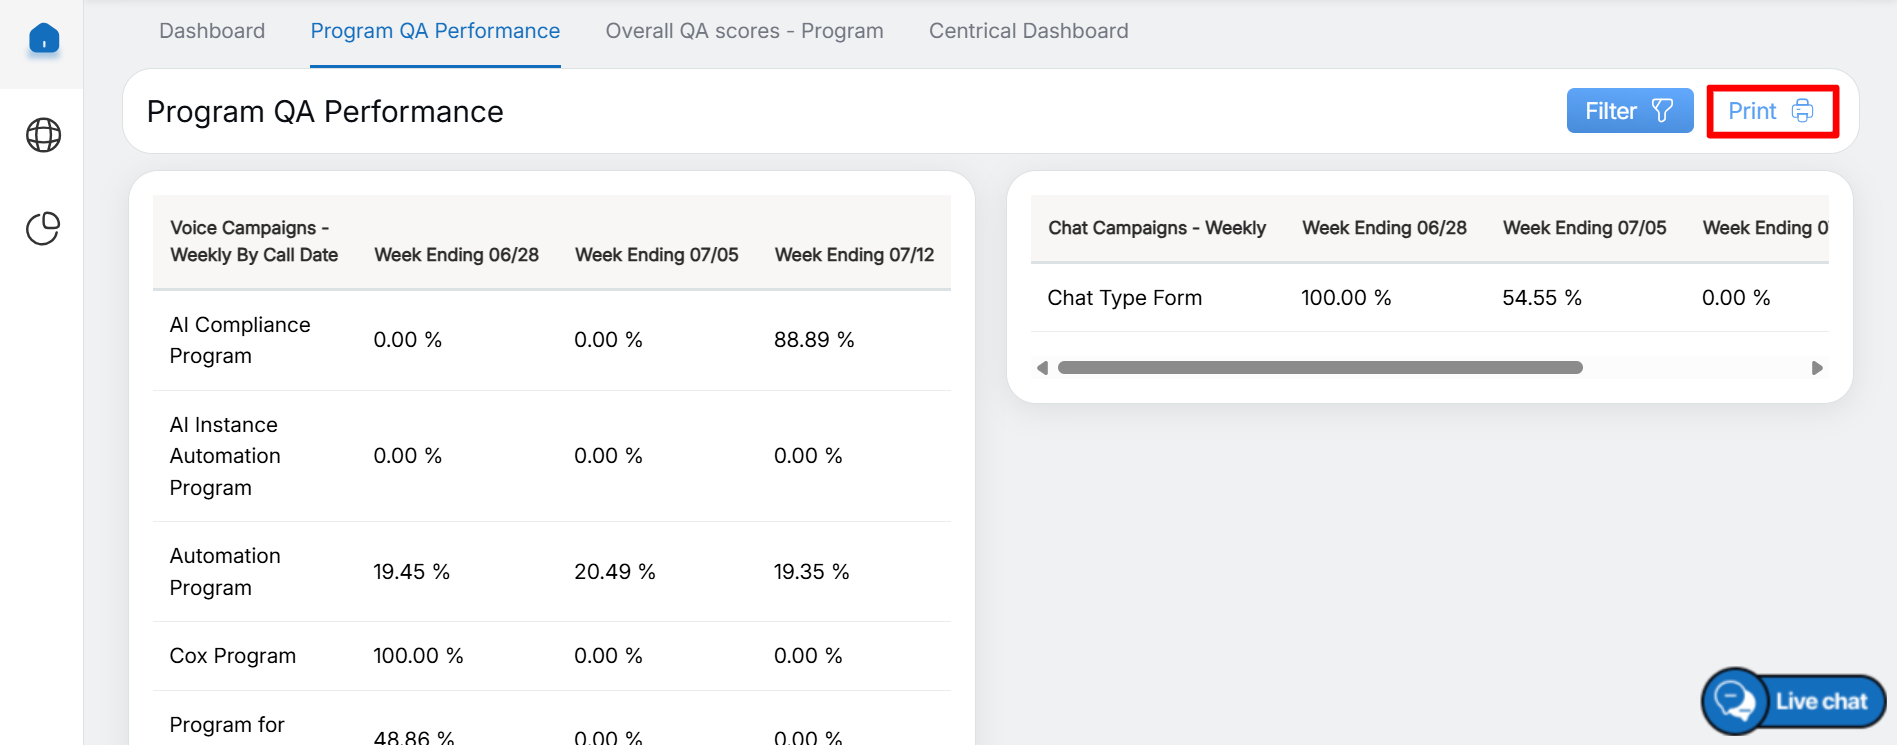
Then the data will get downloaded into the system.
Overall QA Scores – Program
On the Overall QA Score page, the VP can view quality assurance (QA) performance data organized by different categories, including:
- Week-wise QA Scores
- Center-wise QA Scores
- Category-wise QA Scores
- Weekly Top 3 Defect Categories
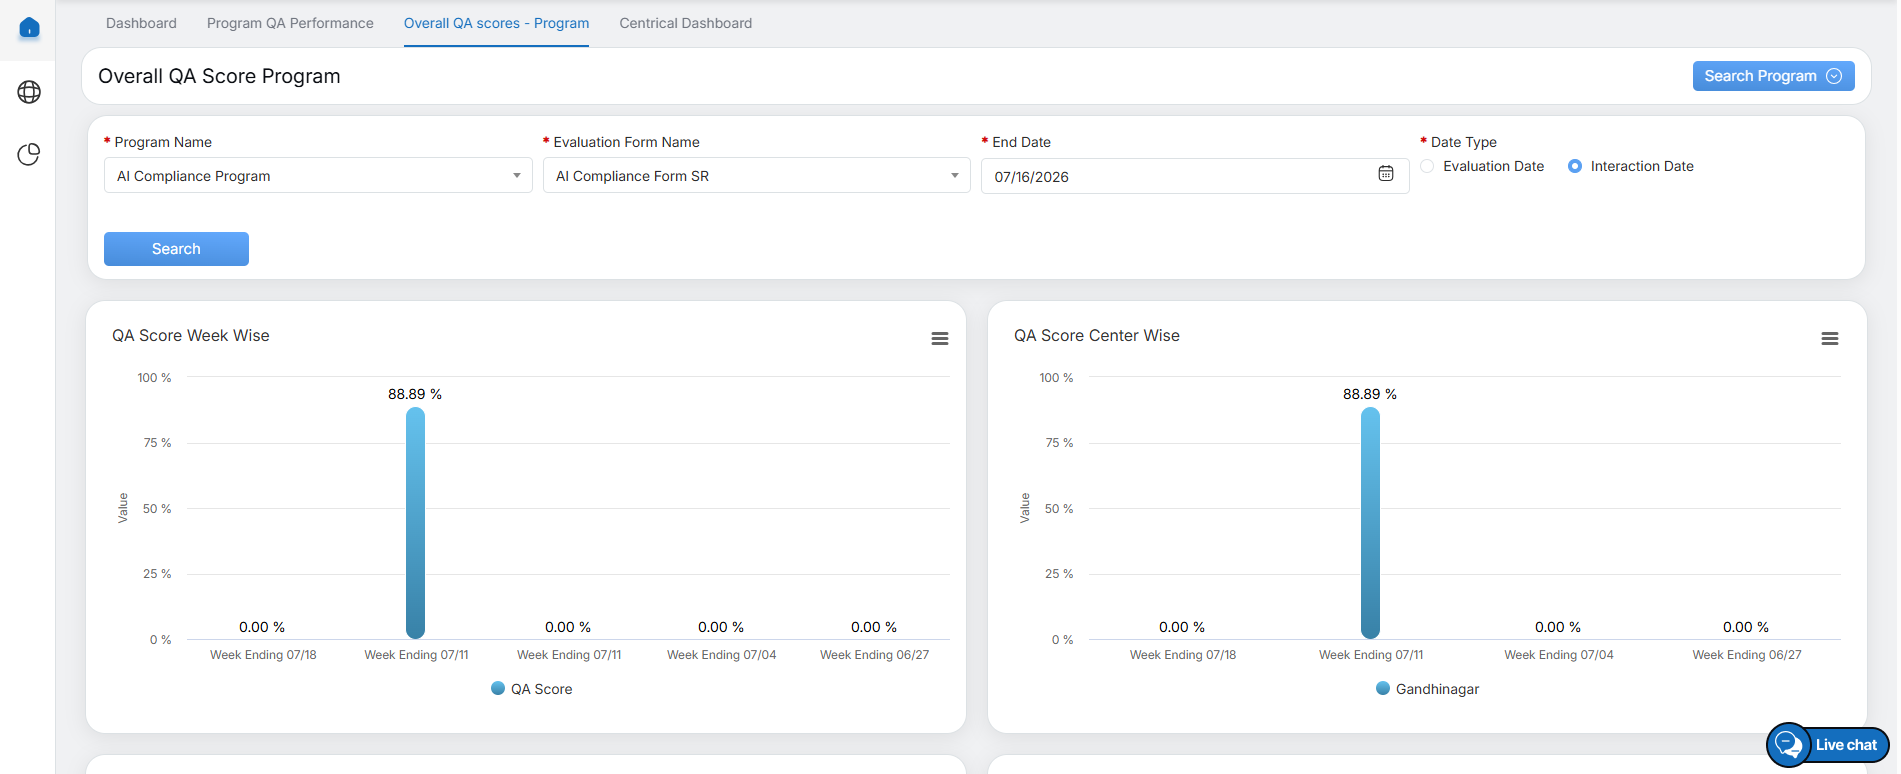
Overall QA Scores – Program Dashboard
To view specific data on the Overall QA Score page, configure the following search filters:
- Program Name: Select the required program from the Program Name drop-down list.
- Evaluation Form Name: Select the required evaluation form from the Evaluation Form Name drop-down list. The available forms are displayed based on the selected program.
- End Date: Select the required end date using the date picker.
After configuring the required filters, click Search.
The system displays the Overall QA Score data based on the selected search criteria.
QA Score Week Wise and QA Score Center Wise
The Overall QA Score statistics are displayed in the form of Bar Charts.
The chart displays the week-wise and center-wise QA scores achieved by all agents.

QA Score Week and Center Wise
QA Score Category Wise
The Overall QA Score statistics are displayed in the form of Bar Charts.
The following chart displays the category-wise QA scores achieved by all agents.
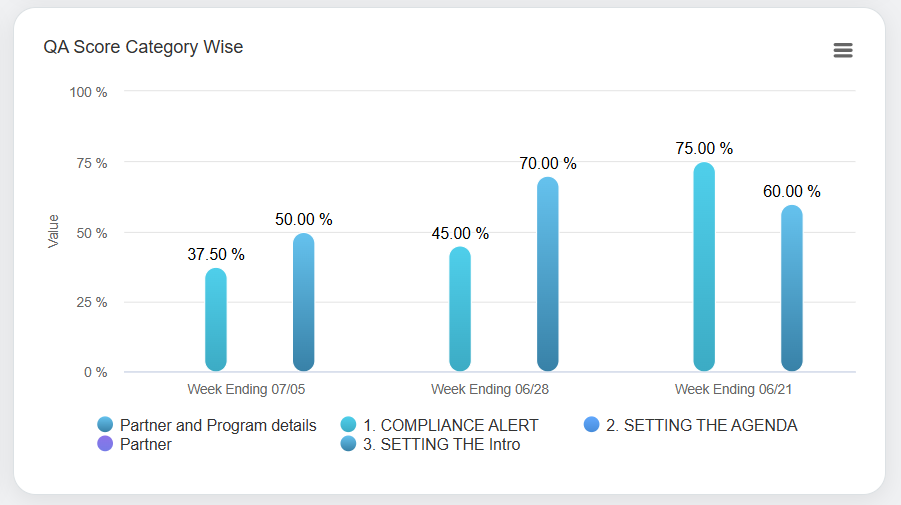
QA Score Category Wise
The above screen displays the data for different categories for every week ending like:
- Partner and Program Details
- Partner
- Compliance Alert
- Setting the Intro
- Setting the Agenda
To view statistics for specific categories, click the required category name(s) displayed in the chart. The chart will be updated to display data only for the selected categories.

QA Score Category Wise
Weekly Top 3 Defects Category
The Weekly Top 3 Defect Categories statistics are displayed in the form of Bar Charts.
The following chart displays the top three defect categories on a weekly basis.
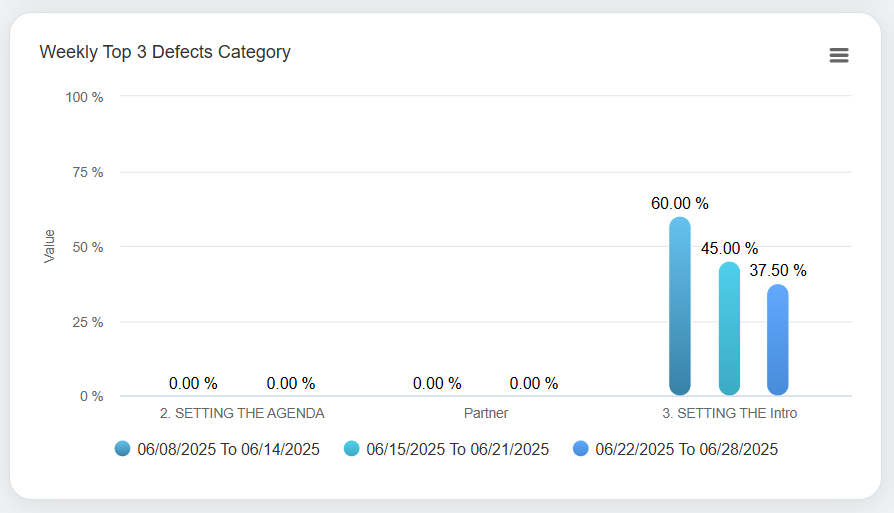
Weekly Top 3 Defects Category
To view statistics for specific week(s), click the required week name(s) displayed in the chart.
The chart will be updated to display data only for the selected week(s), allowing you to analyze the Top 3 Defect Categories for the chosen period, as shown in the screen below.

Weekly Top 3 Defects Category
Video