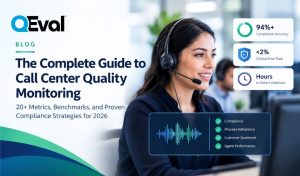
The Complete Guide to Contact Center Quality Assurance: 15+ QA Metrics, Benchmarks, and Proven Improvement Strategies for 2026

Ninety percent of contact centers running a formal quality assurance program consider it effective at improving service quality¹, yet the same programs typically review only 1 to 5 percent of the interactions they exist to monitor²⁴. That gap, between what a QA program is supposed to see and what it actually reviews, is the problem this guide addresses.
The pressure on that gap is rising. McKinsey & Company research cited in recent industry benchmarking finds that 61 percent of customer care leaders have seen call volumes increase, driven by larger customer bases and more contacts per customer¹⁰. More volume without proportional QA headcount widens the sampling gap unless the underlying QA model changes.
This guide lays out 15 metrics that define a contact center QA program, the benchmarks worth targeting for each, a 5-step framework for building or rebuilding a QA scorecard, and the questions worth asking before choosing a QA platform, manual or automated.
What Is Contact Center Quality Assurance?
Contact center quality assurance (QA) is the structured process of evaluating customer interactions against a defined scorecard to measure how consistently agents meet compliance, service, and communication standards. A QA program combines three elements: a scorecard that weights specific behaviors and requirements, an evaluation method, manual review, automated scoring, or both, that applies the scorecard to real interactions, and a feedback loop that turns evaluation results into coaching.
The discipline sits inside the broader category of quality management, alongside compliance monitoring and coaching workflows, and it applies across every channel a contact center operates: voice, chat, email, and increasingly, interactions between customers and AI agents.
QA differs from customer satisfaction measurement. CSAT and NPS capture how the customer experienced the interaction; QA captures whether the agent, or AI agent, followed the process, standards, and required disclosures the organization set, independent of how the customer felt about the outcome. The two are related, since consistent QA scores tend to correlate with more consistent CSAT, but they measure different things, and neither substitutes for the other.
Quality Assurance by the Numbers
- 90%+ of contact centers with a formal QA program consider it effective at improving service quality¹
- Manual QA sampling typically reviews just 1 to 5% of interactions industry-wide²⁴
- The most common manual QA standard is roughly 4 evaluations per agent per month⁶
- A single QA analyst can review approximately 8 to 10 interactions in detail per day⁸
- 61% of customer care leaders report rising call volumes, widening the QA sampling gap further¹⁰
Where Automated Quality Assurance Fits
Automated quality assurance does not replace the QA discipline described above. It changes which of the three elements, scorecard, evaluation method, or feedback loop, is the constraint. Where a manual QA program is limited by evaluator headcount, an automated program is limited by scorecard design and coaching follow-through.
QEval®, the performance management platform built by ETS Labs, applies this as Score, Coach, Improve: every interaction is scored against the organization’s own scorecard, flagged findings route into a coaching workflow, and outcomes are tracked back to the coaching that produced them. Classification runs at 94%+ accuracy against a contractual SLA, compared with the 65 to 70% accuracy typical of keyword-based tools, and coverage is adjustable from a pilot percentage up to 100% of interactions rather than fixed at whatever a QA team can review by hand. Compliance-specific accuracy runs at 98%+, with 95%+ recall on flagged violations, and personally identifiable and protected information is redacted through named entity recognition before any interaction reaches the scoring model.
Full coverage does not, by itself, close the sampling gap. A program that scores 100% of interactions but routes none of the findings into coaching has traded one bottleneck for another. The metrics below are built around that principle: coverage, consistency, and follow-through, measured together.
15 Contact Center QA Metrics to Track
The metrics below are grouped into five categories that mirror how a QA program actually operates: scoring, compliance, consistency, coverage, and outcomes. A program that tracks only the first category is measuring quality without measuring whether the measurement itself can be trusted.
Quality Scoring Metrics
- Internal Quality Score (IQS)
Definition: A composite score that rolls every scorecard criterion into a single number representing an agent’s overall QA performance on an interaction.
Benchmark: 88% is the most commonly cited industry reference point².
Calculation: (Points earned ÷ Points possible) × 100, weighted by criterion.
- Critical Error Rate
Definition: The percentage of evaluated interactions containing at least one zero-tolerance violation, such as a missed required disclosure or a data security failure, regardless of how the rest of the interaction scored.
Calculation: (Interactions with a critical error ÷ Total interactions evaluated) × 100.
Note: Most scorecards treat a critical error as an automatic fail, scored independently of the composite IQS, so one serious violation cannot be averaged away by an otherwise strong interaction.
- QA Score Trend
Definition: The change in average QA score across a defined period, the metric that shows whether coaching is changing behavior rather than just documenting it.
Calculation: Current-period average score minus prior-period average score, tracked monthly or quarterly.
Compliance and Risk Metrics
- Compliance Adherence Rate
Definition: The percentage of evaluated interactions in which required compliance language, consent statements, and disclosures were fully and correctly delivered.
Benchmark: Regulated industries, financial services, healthcare, insurance, commonly target 95% or higher.
- Compliance Violation Detection Rate
Definition: The share of actual compliance violations present in a set of interactions that the QA process successfully identifies, as opposed to what a sample happens to catch.
Note: Spot-checking 1 to 3% of interactions manually is not statistically reliable for catching rare, high-severity violations before they compound⁹.
- Sensitive Data Redaction Accuracy
Definition: The percentage of interactions in which card numbers, health information, or other personally identifiable data referenced during the call is correctly identified and removed before the transcript or recording is stored or scored.
Note: Redaction timing, before versus after an interaction is processed, determines whether sensitive data ever reaches storage or a scoring model in the first place.
- Script and Disclosure Adherence
Definition: The percentage of required script or disclosure elements delivered, in substance if not verbatim.
Note: Programs that score this too rigidly end up rewarding recitation over genuine resolution; the metric works best paired with a customer outcome measure.
Consistency and Calibration Metrics
- Calibration Variance
Definition: How closely different evaluators score the same interaction when scoring the same criteria against the same scorecard.
Benchmark: 85% or higher inter-rater agreement is the commonly cited target³⁵.
Note: Programs that run regular calibration sessions, evaluators independently scoring the same interaction and reconciling differences, report materially tighter variance than programs that calibrate only after a dispute.
- Automated-to-Manual Agreement Rate
Definition: For programs running automated and manual scoring in parallel, the rate at which the two methods land on the same or a materially similar score.
Note: Validates an automated scoring model against human judgment before an organization relies on it at full coverage.
- Evaluator Drift
Definition: Whether a single evaluator’s own scoring stays consistent over time, distinct from consistency between different evaluators (calibration variance, above).
Note: Drift is harder to catch than disagreement between evaluators, since there is no second scorer in the moment to flag it; it typically surfaces only in a trend line.
Coverage and Efficiency Metrics
- Interaction Coverage Rate
Definition: The percentage of total interactions, across every channel, that are actually evaluated.
Benchmark: Manual QA sampling reviews roughly 1 to 5% of interactions industry-wide⁴⁷⁸; automated scoring can extend coverage up to 100% without a proportional increase in QA headcount.
Calculation: (Interactions evaluated ÷ Total interactions handled) × 100.
- QA Analyst Throughput
Definition: The number of interactions one QA analyst can evaluate in detail within a given period.
Benchmark: Manual review typically caps around 8 to 10 interactions per analyst per day, and roughly 4 evaluations per agent per month is the common manual QA standard⁶⁸.
- Time-to-Coach
Definition: The elapsed time between an interaction being flagged and the agent receiving coaching feedback on it.
Benchmark: Feedback delivered within 48 hours is considered high-performing³; delayed feedback measurably loses its effect on behavior.
Coaching and Outcome Metrics
- Coaching Completion Rate
Definition: The percentage of flagged coaching opportunities that are actually delivered to the agent within the program’s target window, not merely identified in a report.
Note: A QA program that scores interactions but does not close the loop into coaching is measurement without improvement.
- Quality-Driven Repeat Contact Rate
Definition: The share of repeat contacts, customers calling or messaging back about the same issue, that trace to a quality failure identified in QA scoring, as distinct from a product or process issue outside the agent’s control.
Note: Connects QA scoring to a customer-facing outcome rather than treating the QA score as a number that only exists internally.
Building a QA Scorecard: A 5-Step Framework
A scorecard is the operating system of a QA program. Get the following five steps right and the metrics above become signal rather than noise.
- Define the quality pillars. Most scorecards group criteria into four to six pillars: compliance, communication and soft skills, process adherence, resolution effectiveness, and, where relevant, sales or retention behavior. Fewer than four pillarstends to miss real coaching signal; more than six makes the scorecard too heavy to score consistently.
- Weight critical versus non-critical criteria separately. A missed compliance disclosure and a slightly abrupt tone are not the same category ofproblem. Score them on separate tracks, a pass or fail gate for critical items and a weighted point scale for everything else, so one does not dilute the other.
- Calibrate before scaling. Run weekly calibration sessions when a scorecard is new or has changed, dropping to monthly once evaluator agreement holds above 85%³⁵. Skipping this step is the most common reason QA programs lose credibility with agents.
- Seta coverageand sampling strategy deliberately, not by default. Decide what percentage of interactions the program needs to review to catch the violations and coaching moments that matter, rather than defaulting to whatever a fixed QA headcount can manage.
- Close the loop with coaching, and measure that the loop closes. A finding that never reaches the agent is not a QA outcome; it is a report. Track coaching completion rate and time-to-coach with the same discipline applied to the QA score itself.
Manual Sampling vs Automated Quality Assurance
The choice between manual and automated QA is not all-or-nothing; most programs run some blend of the two. The comparison below is architectural, not a claim that one approach is universally correct. Regulated, high-volume, or multi-channel operations tend to outgrow manual-only sampling faster than smaller, single-channel teams do.
| Dimension | Manual Sampling | Automated Quality Assurance |
| Coverage | Typically 1 to 5% of interactions | Adjustable, up to 100% |
| Consistency | Varies by evaluator; requires ongoing calibration | Applies the same scorecard logic to every interaction |
| Speed | Days to weeks between interaction and review | Interactions scored within minutes of completion |
| Compliance detection | Limited to what falls inside the sample | Every interaction checked against every compliance rule |
| Cost per evaluation | Scales with QA analyst headcount | Scales with interaction volume, not headcount |
| What it still requires | Trained evaluators, calibration discipline | Human review of flagged edge cases, coaching follow-through |
Automated coverage removes the sampling constraint. It does not remove the need for calibration, edge-case review, or coaching follow-through, the same disciplines a manual program depends on.
What to Evaluate in a QA Platform
Whether a QA program stays manual, moves to automated scoring, or runs both, the following questions apply to any vendor or internal build under consideration. None of them assume a specific answer; they are the questions a QA leader should be able to answer before signing a contract or building a scorecard in-house.
- Coverage flexibility: can coverage adjust from a pilot percentage up to 100% without renegotiating the contract?
- Accuracy transparency: does the vendor publish, and contractually guarantee, a classification accuracy figure, or only claim to be AI-driven?
- Calibration and audit trail: can you see why an interaction received a given score, not just the score itself?
- Compliance certifications: SOC 2, HIPAA, PCI DSS, GDPR, as applicable to your industry?
- Redaction timing: is sensitive data removed before or after the transcript is processed and stored?
- Time-to-coach: how quickly does a flagged interaction reach the agent’s coaching queue?
- Integration footprint: does it connect to the CCaaS, CRM, and workforce management systems already in place?
- Exit terms: what happens if the accuracy or deployment timeline commitments are not met?
What Improved QA Delivers
Programs that close the loop between QA scoring and coaching see the effect beyond the QA scorecard itself. In an anonymized Fortune 500 automotive enterprise deployment across five brands and 1,200 agents, moving to full-coverage automated QA drove an 85% reduction in compliance violations and a 13 percentage-point improvement in QA scores. Total documented annual value across quality, customer, and operational outcomes reached $6.5 million, with 82% of that value coming from outcomes beyond QA labor savings alone: customer retention, coaching efficiency, and operational capacity. In a separate anonymized mid-size U.S. bank deployment, full-coverage compliance monitoring identified $2.8 million in annual savings tied to previously undetected violations.
Neither result came from the QA score alone. Both came from pairing full-coverage scoring with a coaching workflow that acted on what the scoring found, the same principle behind the 5-step framework above. A QA program that scores every interaction but does not change what happens after the score is a measurement exercise. A QA program that closes that loop is a performance management discipline.
Frequently Asked Questions
Q: What is contact center quality assurance?
A: Contact center quality assurance is the structured process of evaluating customer interactions against a defined scorecard to measure compliance, communication, and process adherence. A QA program combines a scorecard, an evaluation method, and a coaching feedback loop; it measures whether standards were followed, not how the customer felt about the outcome.
Q: What percentage of calls does manual QA typically review?
A: Manual QA sampling typically reviews 1 to 5% of interactions industry-wide, largely because a single analyst can review only around 8 to 10 interactions in detail per day. Automated scoring can extend coverage up to 100% without a proportional increase in QA headcount.
Q: What is a good QA score benchmark to target?
A: 88% is the most commonly cited Internal Quality Score benchmark across contact center QA programs. The right target for a specific program depends on scorecard weighting and industry, and scores are best reviewed against a trend line, month over month, rather than treated as a single static number.
Q: How is compliance adherence measured in a contact center?
A: Compliance adherence is measured as the percentage of evaluated interactions in which required disclosures, consent language, and regulatory statements were fully delivered. Regulated industries, financial services, healthcare, and insurance, commonly target 95% or higher, and treat any missed critical disclosure as an automatic fail independent of the overall QA score.
Q: What is calibration in call center QA, and why does it matter?
A: Calibration is the practice of having multiple QA evaluators independently score the same interaction and reconcile any differences against the scorecard. It matters because inconsistent scoring between evaluators undermines agent trust in the QA program faster than almost any other failure; 85% or higher inter-rater agreement is the commonly cited target.
Q: How quickly should QA feedback reach an agent?
A: Feedback delivered within 48 hours of the flagged interaction is considered high-performing. Coaching delivered days or weeks after an interaction loses most of its behavioral effect, since the agent no longer has clear recall of the specific interaction being coached.
Contact center quality assurance is not just a scoring exercise. Programs that treat it as one, that score interactions and stop, rarely see quality figures move, because they are not closing the loop that changes agent behavior. The 15 metrics in this guide only produce results when paired with the two disciplines that hold the framework together: calibration, so the numbers mean the same thing across evaluators, and coaching follow-through, so a flagged interaction becomes a changed behavior rather than a line in a report. Organizations that close both loops see the outcome show up in the numbers that matter beyond the scorecard, compliance exposure, coaching efficiency, and customer retention, within the first two quarters of a rebuilt program.
See It Scored Against Your Own Scorecard
QEval® scores every interaction against your own scorecard, with a 94%+ accuracy SLA and a 30-day deployment commitment.
For more on measuring and improving contact center performance, see the companion guide, The Complete Guide to Agent Performance Management.
Manu Dwievedi
Manu joined Etech in March 2014 as an Online Chat Representative. During his tenure, Manu has held responsibilities in various facets of call center, including operations, training as well as quality monitoring & analytics. Manu is driven and passionate about customer experience management, data science, natural language processing, machine learning, and driving innovative conversational AI solutions for business growth.